In this lab, you’ll use the Real-Time Intelligence capabilities in Microsoft Fabric to ingest, analyze, and visualize a real-time stream of stock market data.
Create an eventstream
Open your Fabric workspace and locate the menu bar on the left.
- From the menu bar, select Real-Time:
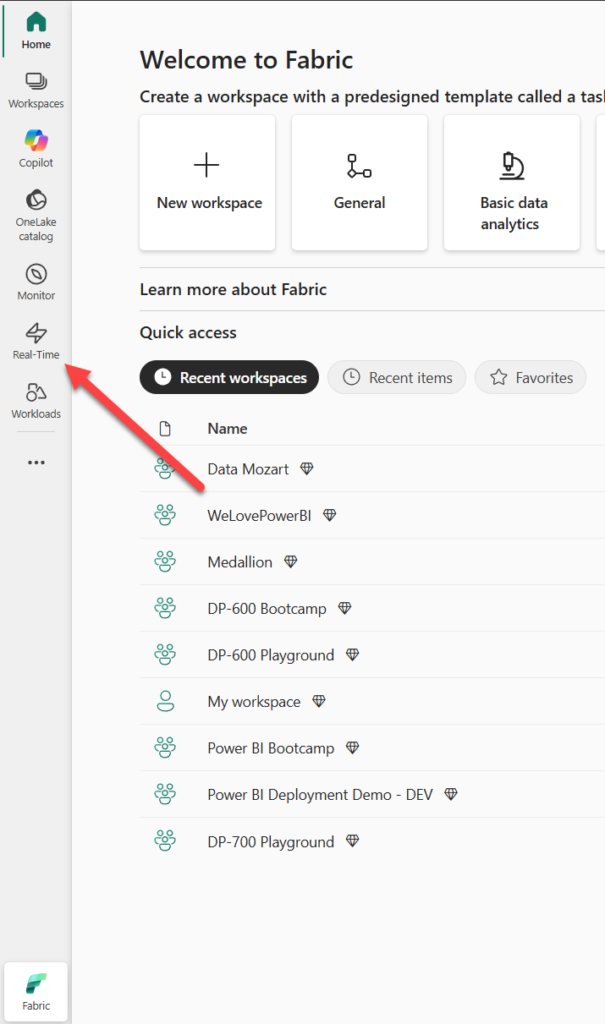
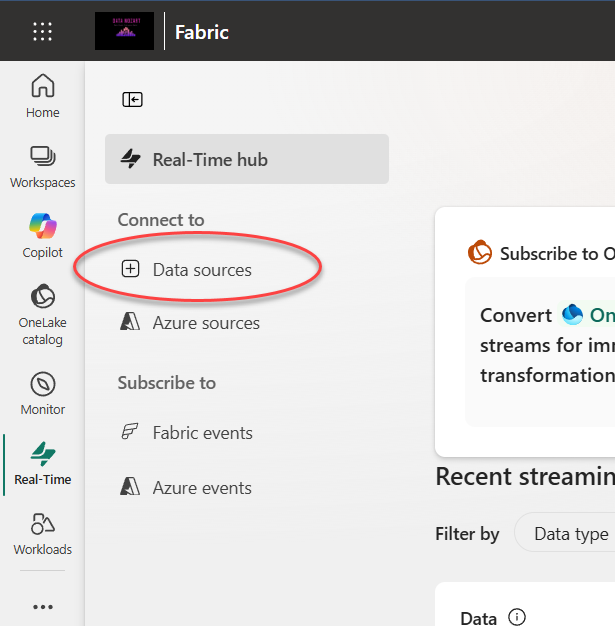
- In the Real-Time Hub, in the Connect to section, select Data Sources.
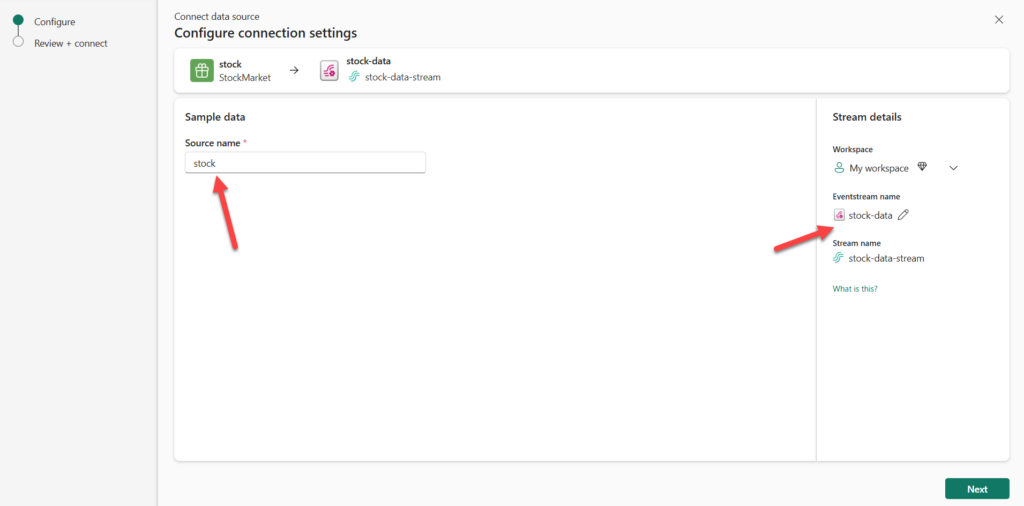
- Find the Stock market sample data source and select Connect. Then in the Connect wizard, name the source
stockand edit the default eventstream name to change it tostock-data. The default stream associated with this data will automatically be named stock-data-stream:
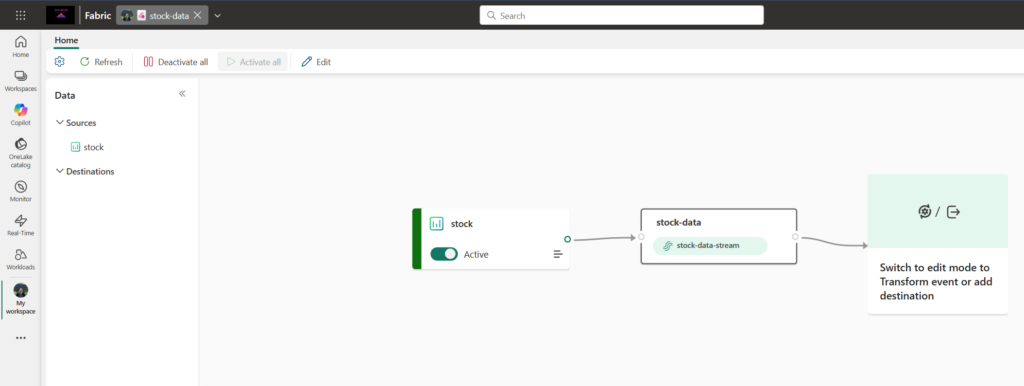
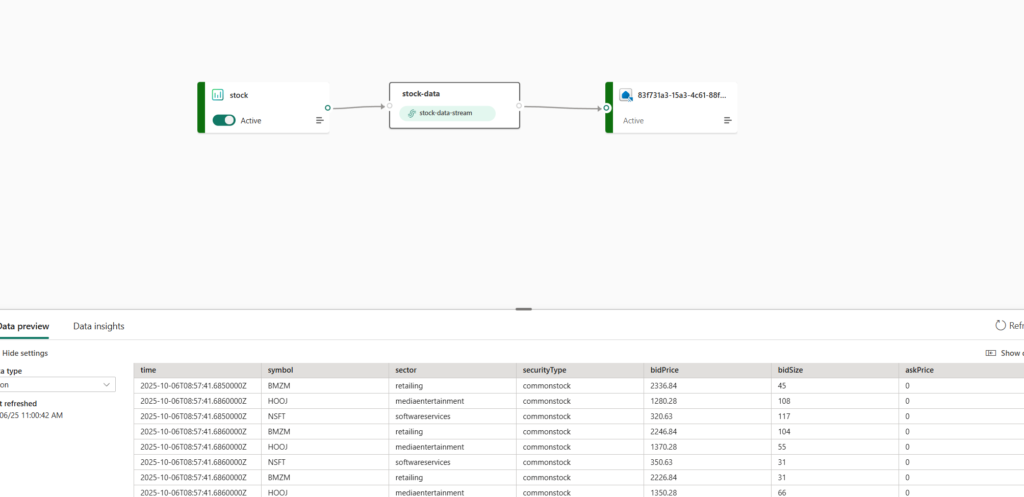
- Select Next, then Connect and wait for the source and eventstream to be created, then select Open eventstream. The eventstream will show the stock source and the stock-data-stream on the design canvas:
Create an eventhouse
The eventstream ingests the real-time stock data, but doesn’t currently do anything with it. Let’s create an eventhouse where we can store the captured data in a table.
- On the menu bar on the left, select Create.

- In the New page, under the Real-Time Inteligence section, select Eventhouse. Give it a name Eventhouse_demo.
You should now be able to see your new empty eventhouse:
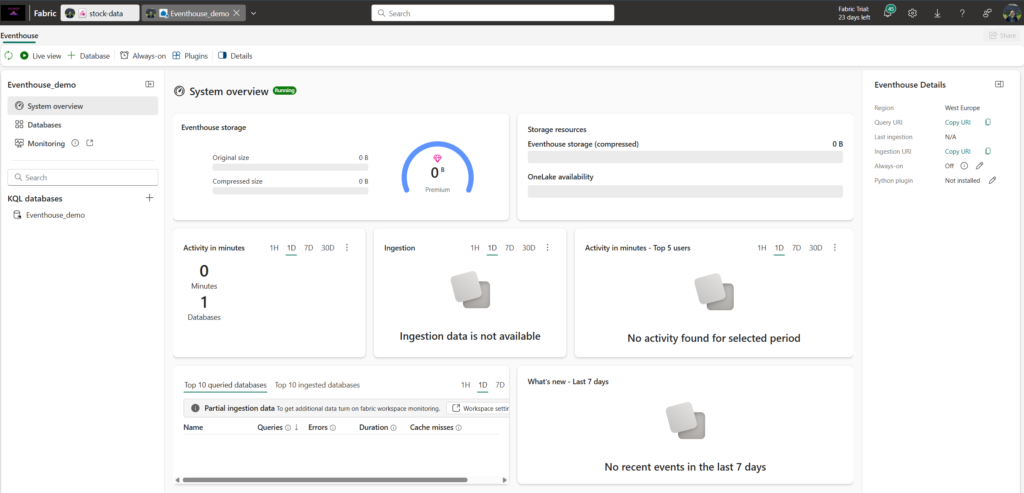
- In the pane on the left, note that your eventhouse contains a KQL database with the same name as the eventhouse. You can create tables for your real-time data in this database, or create additional databases as necessary.
- Select the database, and note that there is an associated queryset. This file contains some sample KQL queries that you can use to get started querying the tables in your database. However, currently there are no tables to query. Let’s resolve that problem by getting data from the eventstream into a new table.
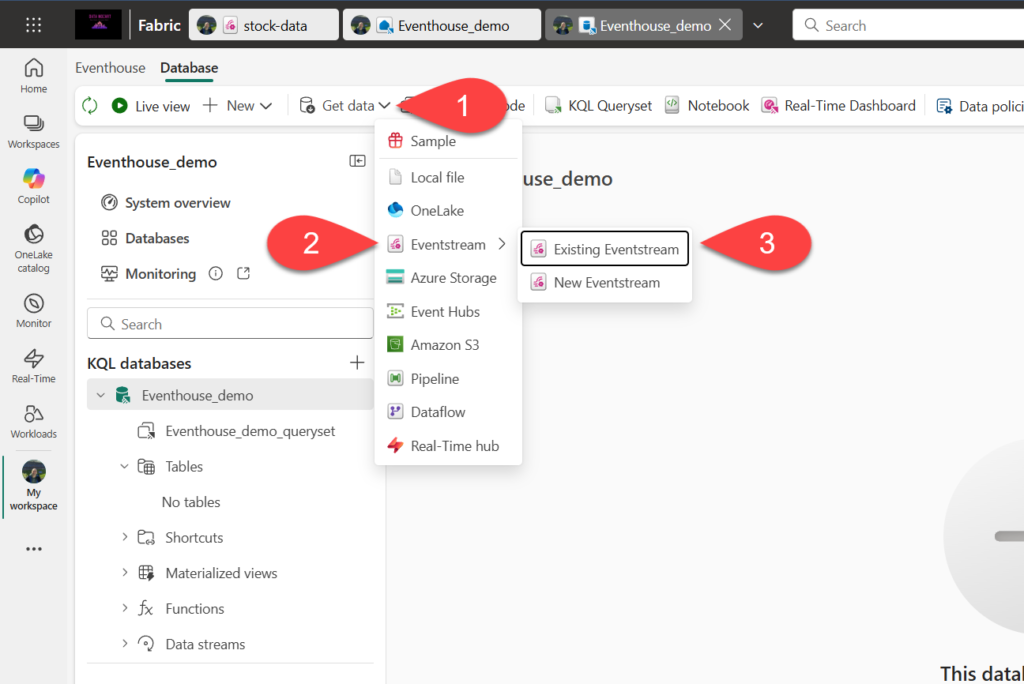
- In the main page of your KQL database, select Get data.
- For the data source, select Eventstream > Existing eventstream.
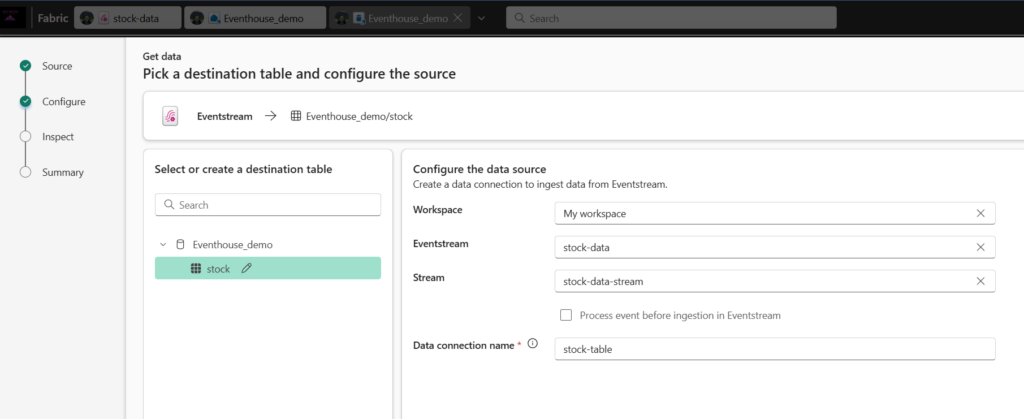
- In the Select or create a destination table pane, create a new table named
stock. Then in the Configure the data source pane, select your workspace and the stock-data eventstream and name the connectionstock-table.
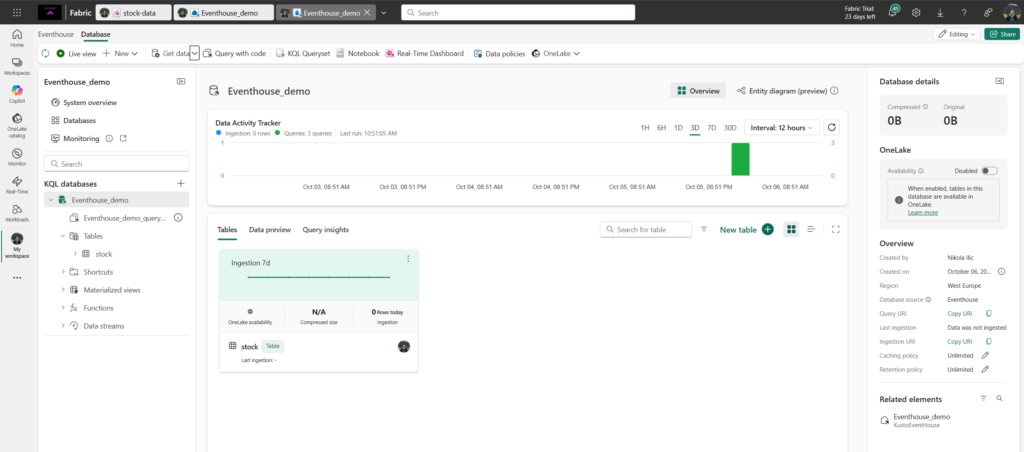
- Use the Next button to complete the steps to inspect the data and then finish the configuration. Then close the configuration window to see your eventhouse with the stock table.
- The connection between the stream and the table has been created. Let’s verify that in the eventstream.
- In the menu bar on the left, select the Real-Time hub. In the … menu for the stock-data-stream stream, select Open eventstream.
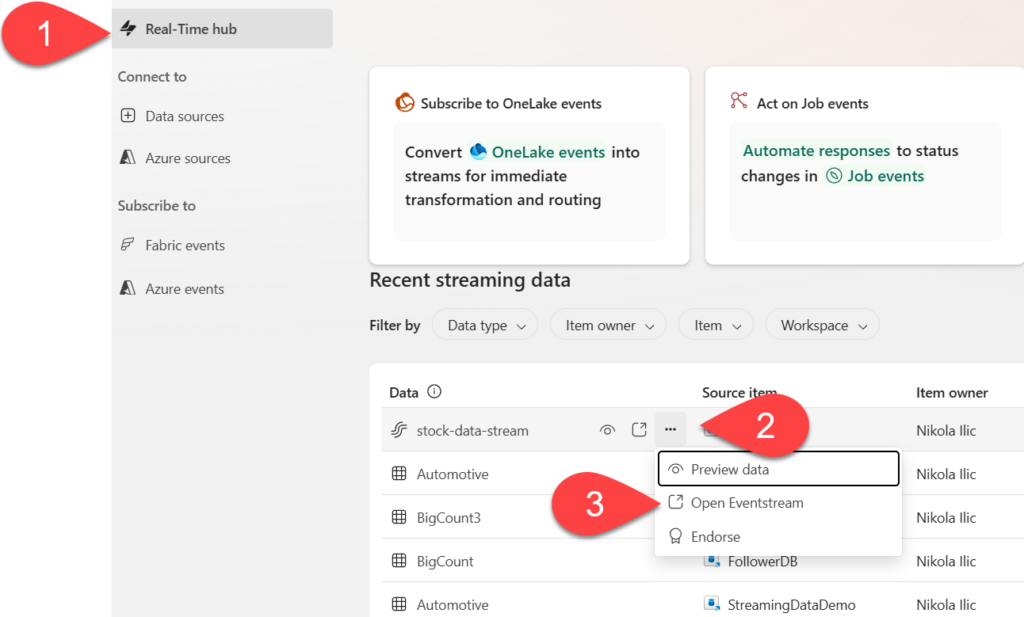
- The eventstream now shows a destination for the stream:
In the previous part of the lab, you’ve created a very simple eventstream that captures real-time data and loads it into a table. In a real solution, you’d typically add transformations to aggregate the data over temporal windows (for example, to capture the average price of each stock over five-minute periods). Now let’s explore how you can query and analyze the captured data.
Query the captured data
The eventstream captures real-time stock market data and loads it into a table in your KQL database. You can query this table to see the captured data.
- In the menu bar on the left, select your eventhouse database.
- Select the queryset for your database.
- In the query pane, modify the first example query as shown here:
 stock
 | take 100
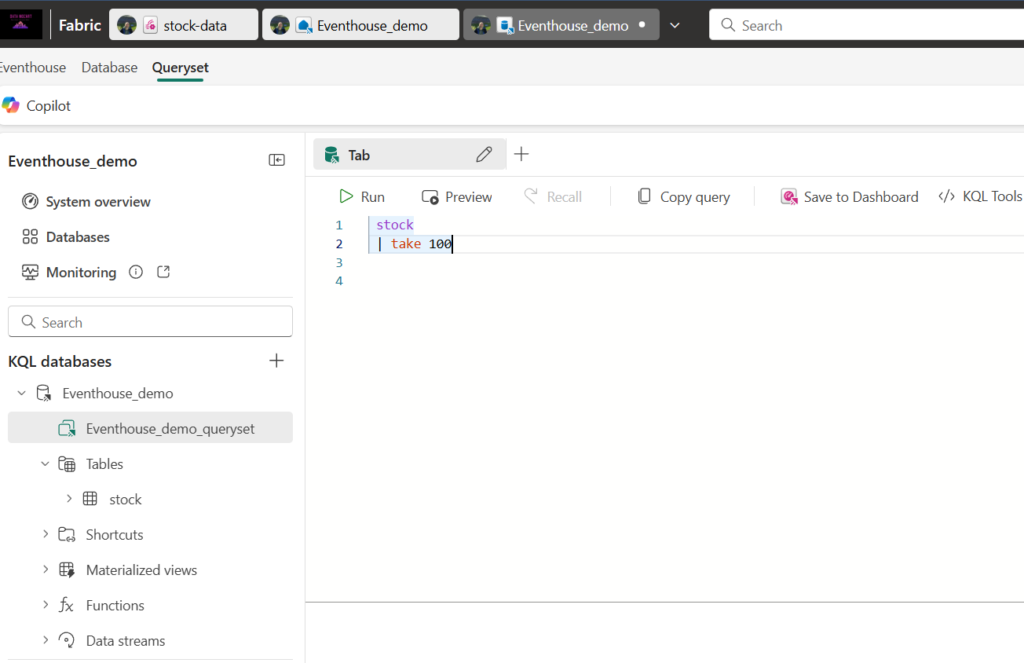
- Select the query code and run it to see 100 rows of data from the table.
- Review the results, then modify the query to retrieve the average price for each stock symbol in the last 5 minutes:
 stock
 | where ["time"] > ago(5m)
 | summarize avgPrice = avg(todecimal(bidPrice)) by symbol
 | project symbol, avgPrice
- Highlight the modified query and run it to see the results.
- Wait a few seconds and run it again, noting that the average prices change as new data is added to the table from the real-time stream.
Create a real-time dashboard
Now that you have a table that is being populated by a stream of data, you can use a real-time dashboard to visualize the data.
- In the query editor, select the KQL query you used to retrieve the average stock prices for the last five minutes.
- On the toolbar, select Save to dashboard. Then pin the query in a new dashboard with the following settings:
- Dashboard name:
Stock Dashboard - Tile name:
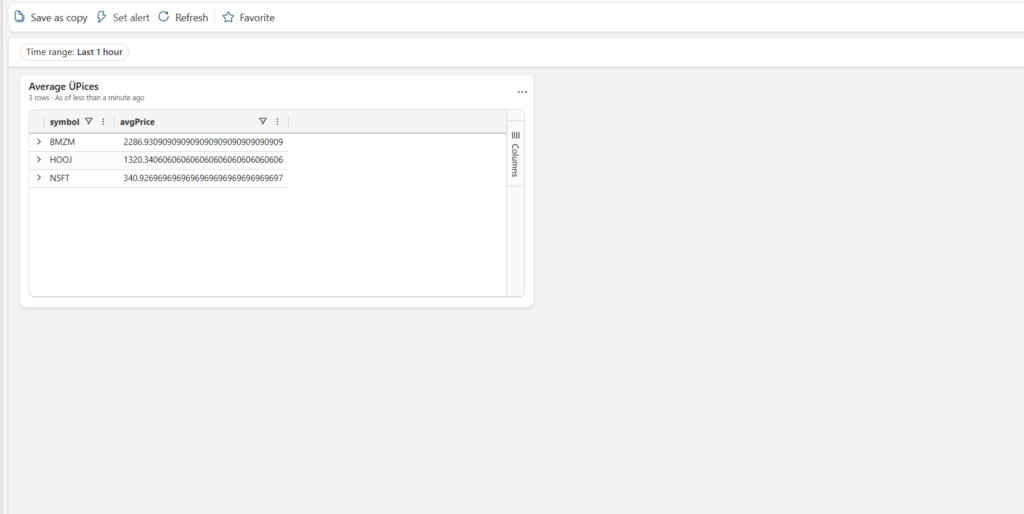
Average Prices
- Dashboard name:

- Create the dashboard and open it. It should look like this:
- At the top-right of the dashboard, switch from Viewing mode to Editing mode.
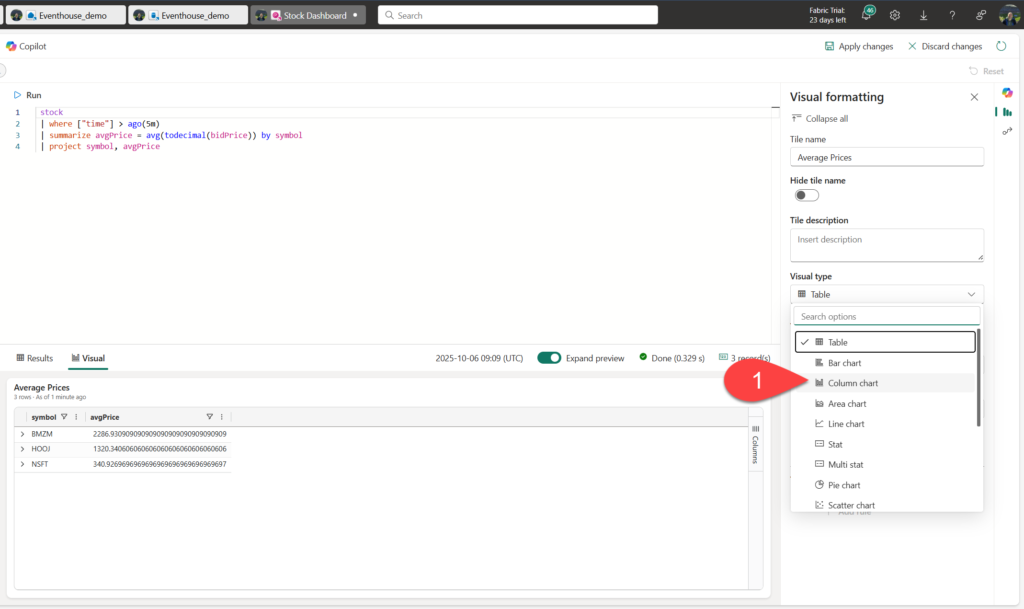
- Select the Edit (pencil) icon for the Average Prices tile.
- In the Visual formatting pane, change the Visual from Table to Column chart:
- At the top of the dashboard, select Apply changes and view your modified dashboard
Now you have a live visualization of your real-time stock data.
Create an alert
Real-Time Intelligence in Microsoft Fabric includes a technology named Activator, which can trigger actions based on real-time events. Let’s use it to alert you when the average stock price increases by a specific amount.
- In the dashboard window containing your stock price visualization, in the toolbar, select Set alert.
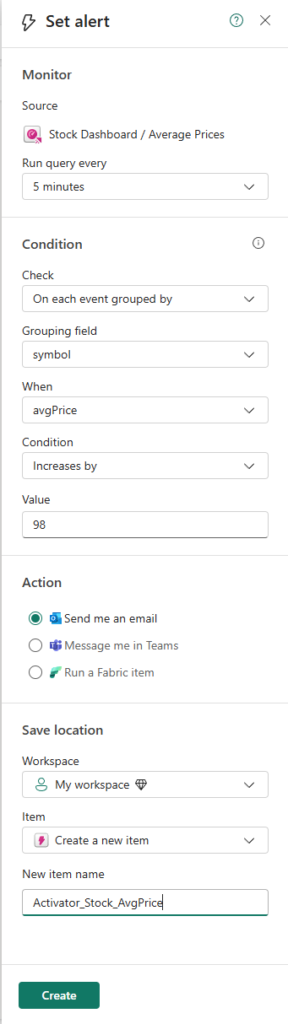
- In the Set alert pane, create an alert with the following settings:
- Run query every: 5 minutes
- Check: On each event grouped by
- Grouping field: symbol
- When: avgPrice
- Condition: Increases by
- Value: 100
- Action: Send me an email
- Save location:
- Workspace: Your workspace
- Item: Create a new item
- New item name: Activator_Stock_AvgPrice
- Create the alert and wait for it to be saved. Then close the pane confirming it has been created.
- In the menu bar on the left, select the page for your workspace (saving any unsaved changes to your dashboard if prompted).
- On the workspace page, view the items you have created in this exercise, including the activator for your alert.
- Open the activator, and in its page, under the avgPrice node, select the unique identifier for your alert. Then view its History tab. Your alert may not have been triggered, in which case the history will contain no data. If the average stock price ever changes by more than 100, the activator will send you an email, and the alert will be recorded in the history.
Great work! You’ve just created your first Real-Time Intelligence workload in Microsoft Fabric! Keep up the momentum and see you in the next lab…