The monitoring hub in Microsoft Fabric provides a central place where you can monitor activity. You can use the monitoring hub to review events related to items you have permission to view.
In this lab, we will use resources we’ve created in previous labs (lakehouse).
Create and monitor a Dataflow
In Microsoft Fabric, you can use a Dataflow (Gen2) to ingest data from a wide range of sources. In this exercise, you’ll use a dataflow to get data from a CSV file and load it into a table in your lakehouse.
- On the Home page for your lakehouse, in the Get data menu, select New Dataflow Gen2.
- Name the new dataflow
Get Product Dataand select Create.
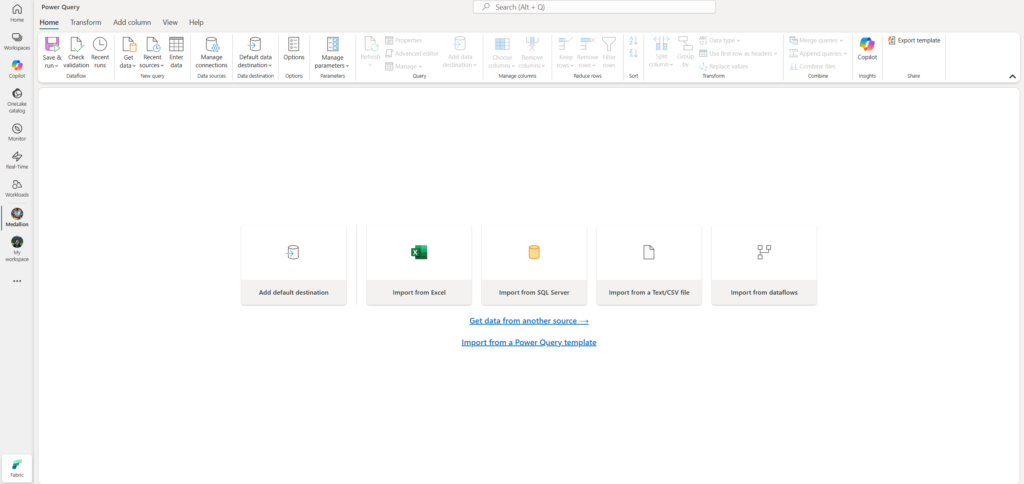
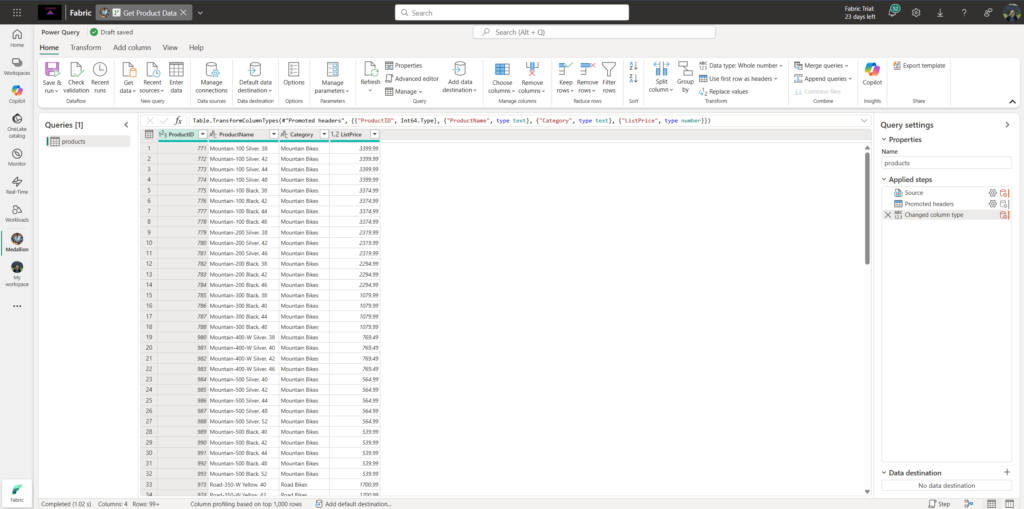
- In the dataflow designer, select Import from a Text/CSV file. Then complete the Get Data wizard to create a data connection by linking to:
https://raw.githubusercontent.com/MicrosoftLearning/dp-data/main/products.csvusing anonymous authentication. When you have completed the wizard, a preview of the data will be shown in the dataflow designer like this:
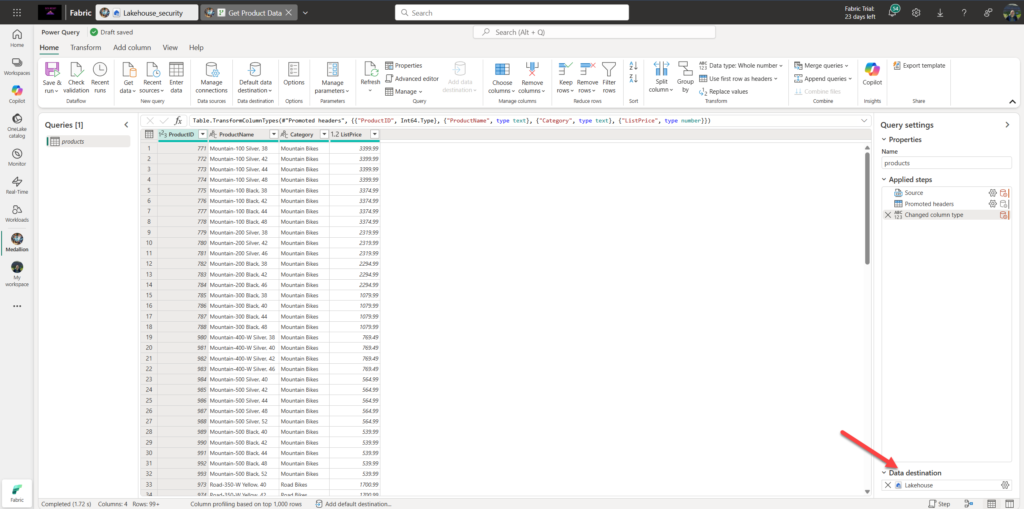
- In the bottom-right corner, add the lakehouse you previously created as a Data destination
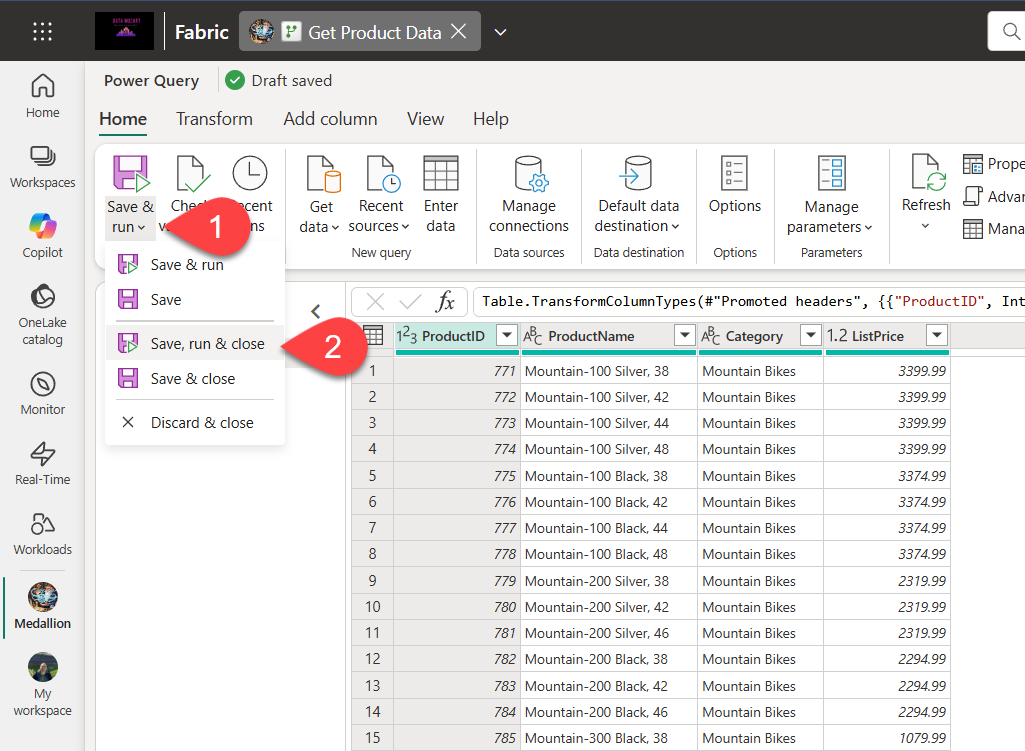
- In the top-left corner, expand the Save & run drop-down menu, and select Save, run & close.
- In the navigation bar on the left, select Monitor to view the monitoring hub and observe that your dataflow is in-progress (if not, refresh the view until you see it).

- Wait for a few seconds, and then refresh the page until the status of the dataflow is Succeeded.
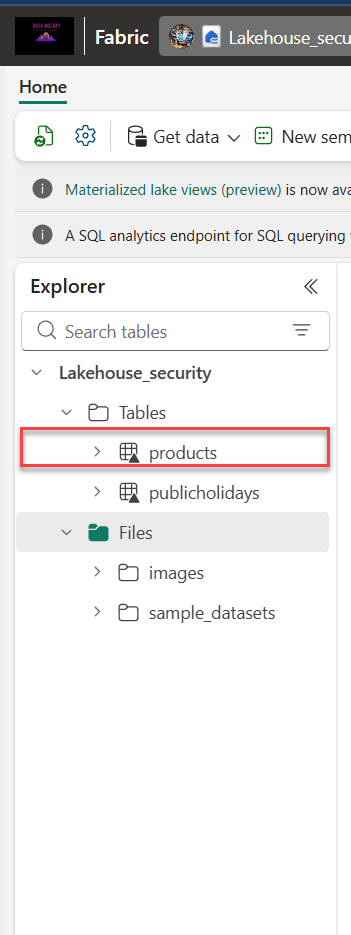
- In the navigation pane, select your lakehouse. Then expand the Tables folder to verify that a table named products has been created and loaded by the dataflow (you may need to refresh the Tables folder).
Create and monitor a Spark notebook
As you’ve already learned, in Microsoft Fabric, you can use notebooks to run Spark code.
- On the menu bar on the left, select Create. In the New page, under the Data Engineering section, select Notebook. A new notebook named Notebook 1 is created and opened.
- At the top left of the notebook, select Notebook 1 to view its details, and change its name to
Query Products. - In the notebook editor, in the Explorer pane, select Add data items and then select Existing data sources.
- Add the lakehouse you created previously.
- Expand the lakehouse item until you reach the products table.
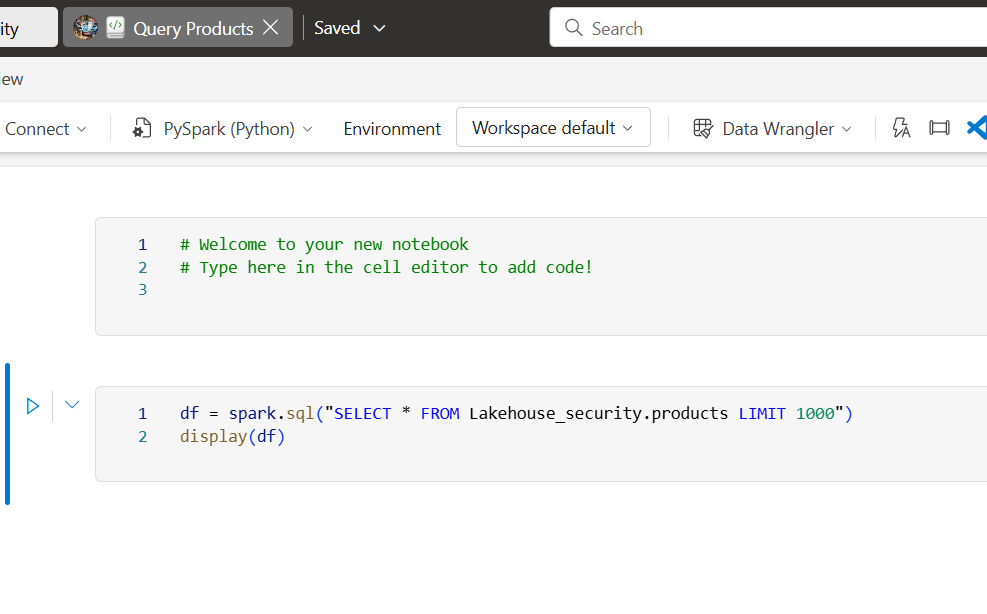
- In the … menu for the products table, select Load data > Spark.

- This adds a new code cell to the notebook as shown here:
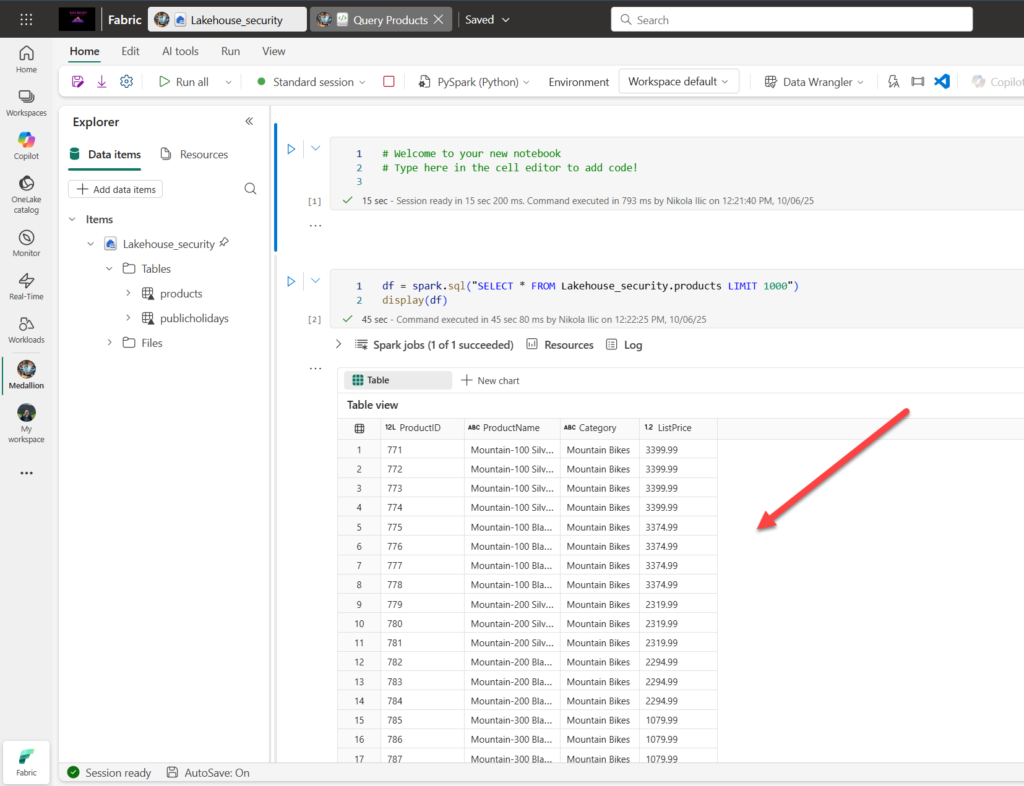
- Use the ▷ Run all button to run all cells in the notebook. It will take a moment or so to start the Spark session, and then the results of the query will be shown under the code cell.
- On the toolbar, use the ◻ (Stop session) button to stop the Spark session.
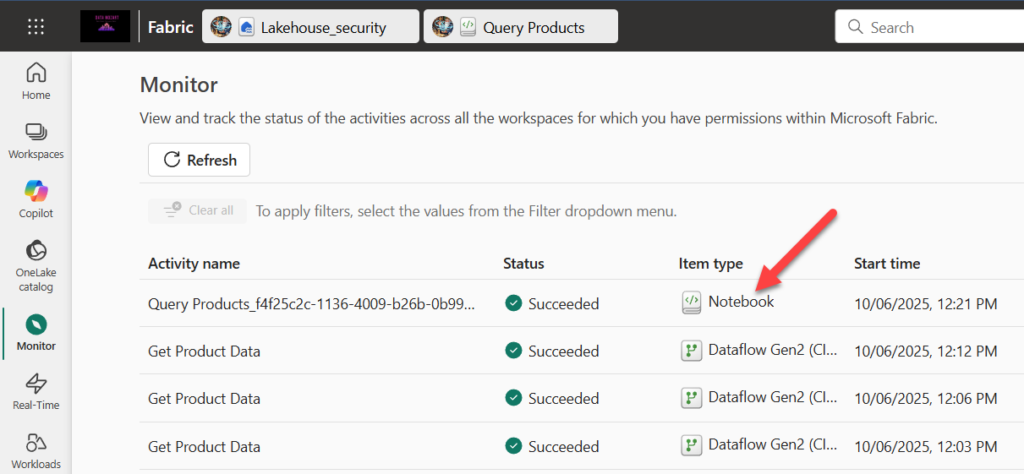
- In the navigation bar, select Monitor to view the monitoring hub, and note that the notebook activity is listed.
Monitor history for an item
Some items in a workspace might be run multiple times. You can use the monitoring hub to view their run history.
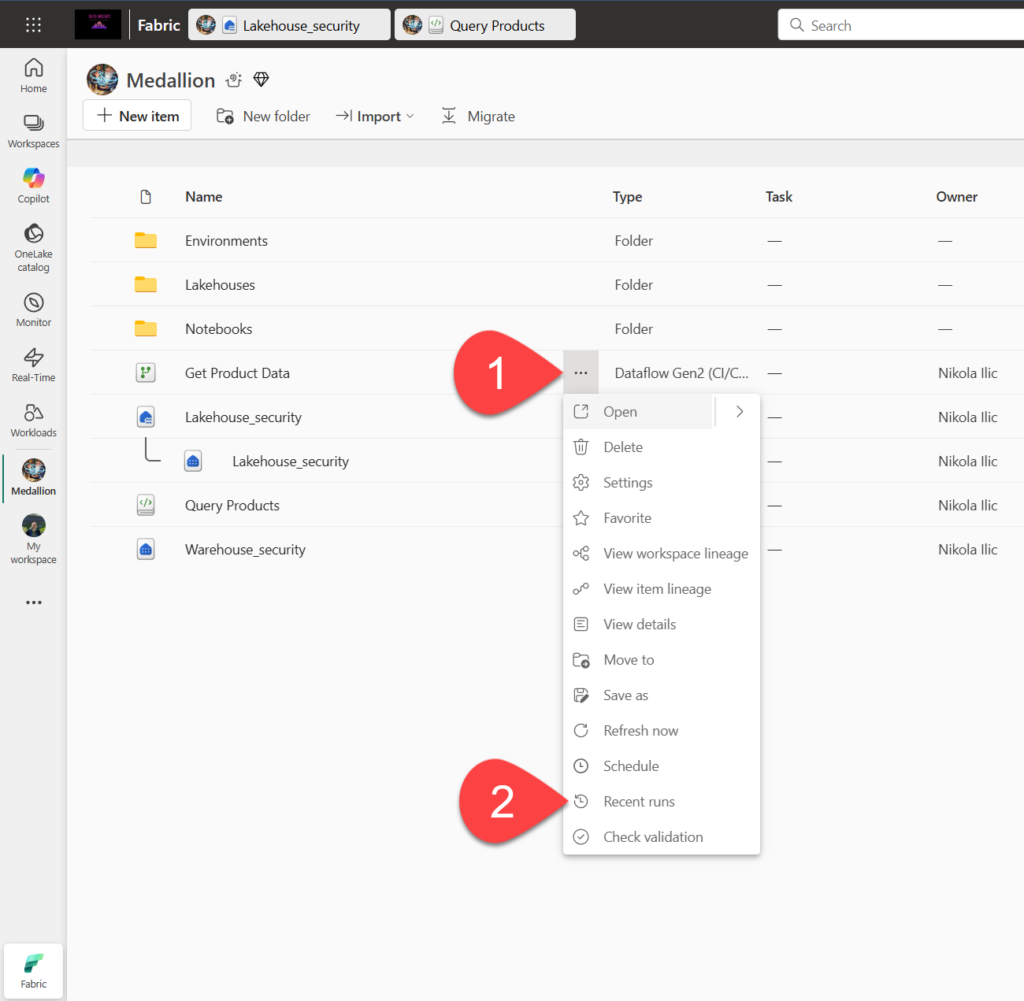
- In the navigation bar, return to the page for your workspace. Then use the ↻ (Refresh now) button for your Get Product Data dataflow to re-run it.
- In the navigation pane, select the Monitor page to view the monitoring hub and verify that the dataflow is in-progress.
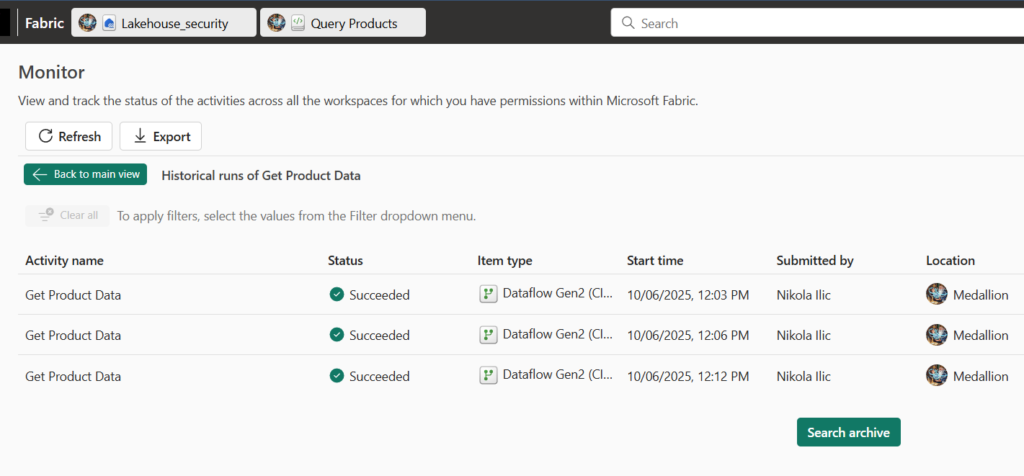
- In the … menu for the Get Product Data dataflow, select Historical runs to view the run history for the dataflow:
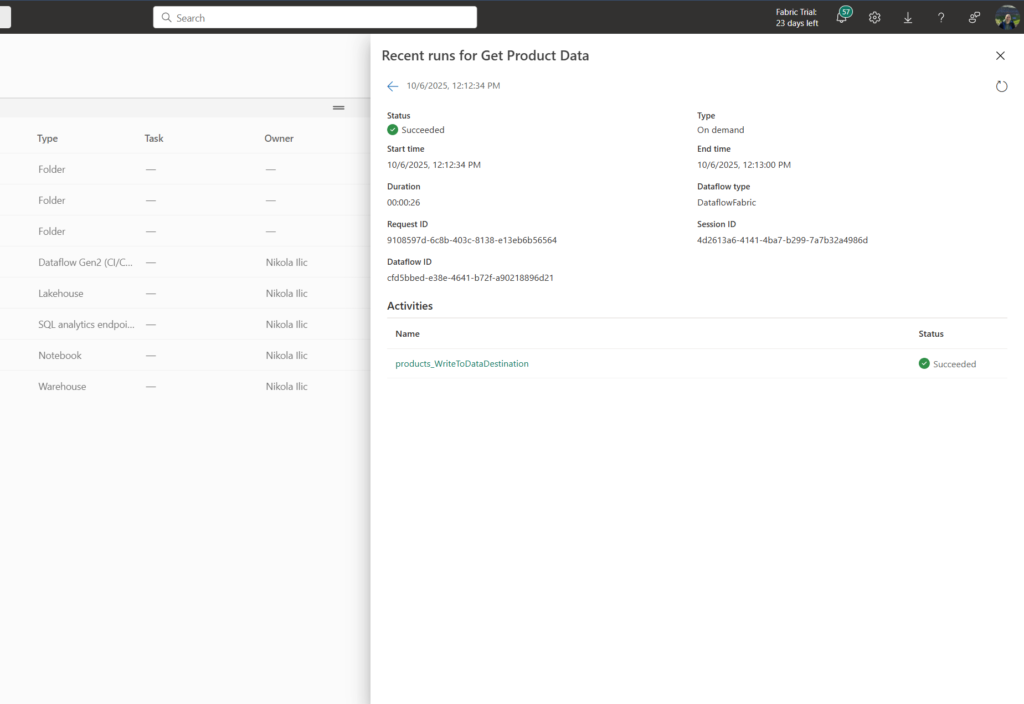
- Go back to the workspace view. In the … menu of the dataflow, select Recent runs.
- From the new dialog window, pick an individual run to see more details about that particular run
Customize monitoring hub views
In this part of the lab, you’ve only run a few activities, so it should be fairly easy to find events in the monitoring hub. However, in a real environment, you may need to search through a large number of events. Using filters and other view customizations can make this easier.
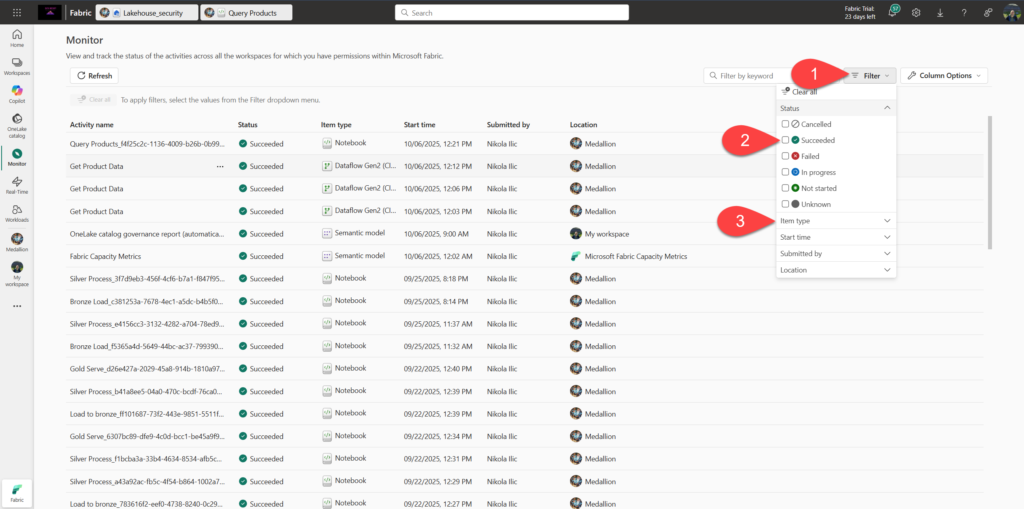
- In the monitoring hub, use the Filter button to apply the following filter:
- Status: Succeeeded
- Item type: Dataflow Gen2
- Use the Column Options button to include the following columns in the view (use the Apply button to apply the changes):
- Activity name
- Status
- Item type
- Start time
- Submitted by
- Location
- End time
- Duration
- Refresh type
You may need to scroll horizontally to see all of the columns.
Amazing! Understanding what’s going on in your Fabric capacity is one of the key requirements for the successful Fabric implementation, especially when things don’t work as expected (and, trust me, this happens more often than we would like:)).
Keep up the great work!