Hey everyone, and welcome to Power BI Labs!
In this lab, we will set the scene for what is to come. The main goal of this lab is to make you familiar with the Power BI Desktop application and its main components, as well as to get data into Power BI.
IMPORTANT: Download the zipped folder with all the necessary files from here. Once downloaded, extract the files to your local PC.
IMPORTANT: Ensure that the setting for automatic detection of the relationships is DISABLED! To do that, open Power BI Desktop -> File -> Options and Settings -> Options. From the current file settings, select the Data Load tab and uncheck all the boxes under the Relationships:

In real life, you will not disable these settings (that’s why they are enabled by default), but for the sake of learning throughout the labs, automatic relationships should be disabled – so that we can create them manually later.
We are now ready to start!
Get Data into Power BI Desktop
- In Power BI Desktop, click on the Get data in the Home ribbon
- Select the Text/CSV from the drop-down menu

- Browse for the folder where you extracted the data
- Click on the ColorFormats CSV file and then click Open
- In the dialog window, choose Transform Data
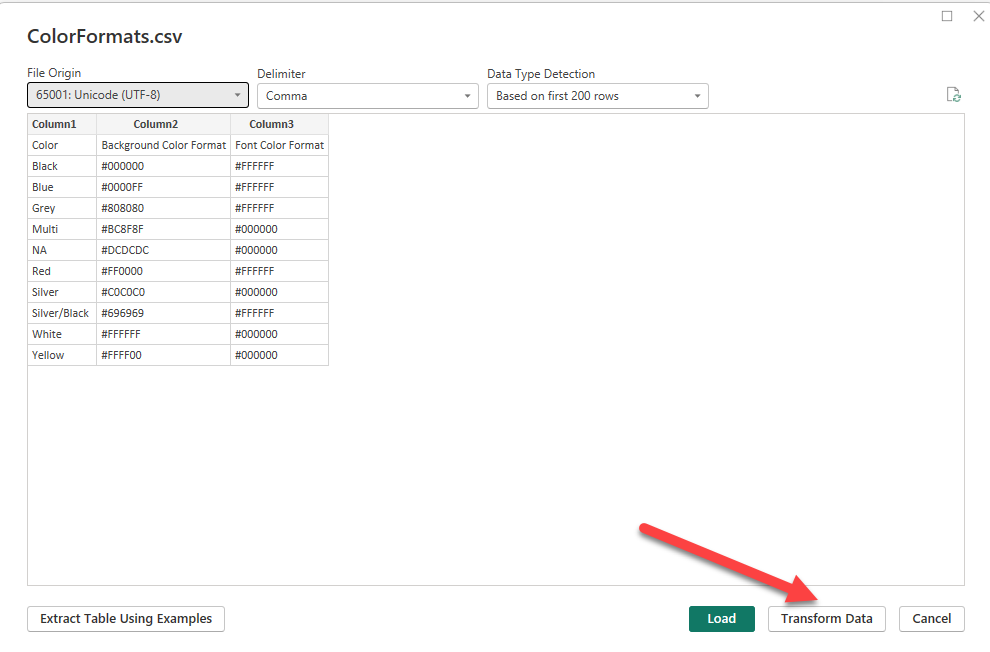
This will launch the Power Query Editor – a built-in tool in Power BI for data transformation and data cleaning. We will use Power Query extensively in the next lab.
- Repeat the same steps for the remaining CSV files
- DimEmployee
- DimEmployeeSalesTerritory
- DimGeography
- DimProductCategory
- DimProductSubcategory
- DimReseller
- DimSalesTerritory
- ResellerSalesTargets
While in Power Query Editor, let’s load the data from Excel files.
- Click on New Source in the top ribbon and select Excel workbook

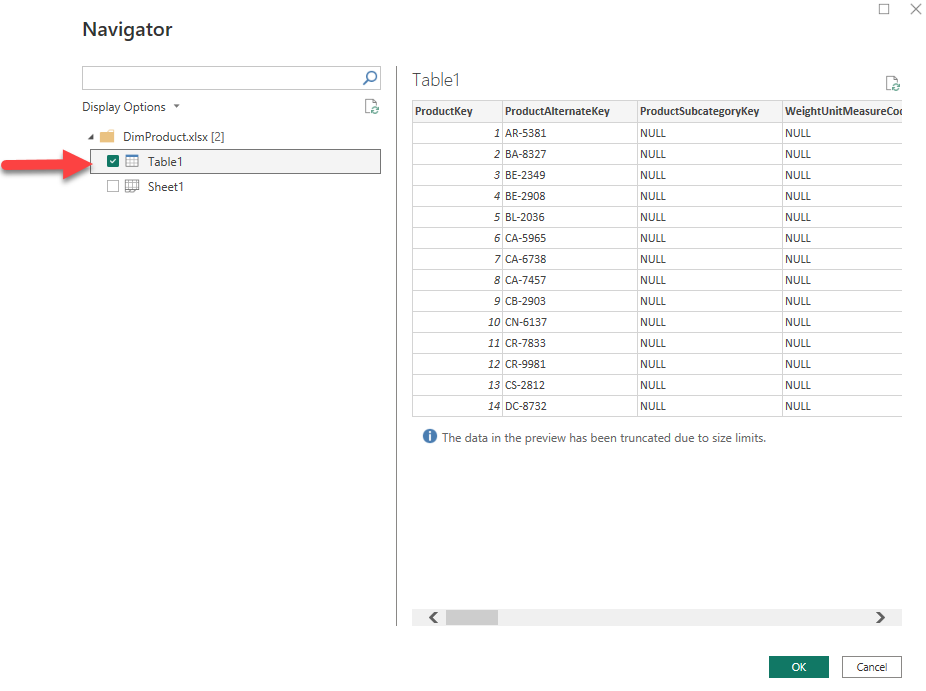
- Select the DimProduct file
- In the Navigator pane, check the Table1 box
- In the left panel, locate the Table1 query
- Double-click on the Table1 query and rename it to DimProduct
- Repeat the same steps to load the FactResellerSales Excel file
- Once loaded, rename it to FactResellerSales
Preview Data in Power Query Editor
This task introduces the Power Query Editor and allows you to review and profile the data. This helps you determine how to clean and transform the data later. You’ll also review both dimension tables prefixed with “Dim” and fact tables prefixed with “Fact”.
- In the Power Query Editor window, on the left, notice the Queries pane. The Queries pane contains one query for each table you checked.
- Select the DimEmployee query.
- At the bottom left corner of the status bar, some table statistics are provided – the table has 28 columns, and 296 rows.

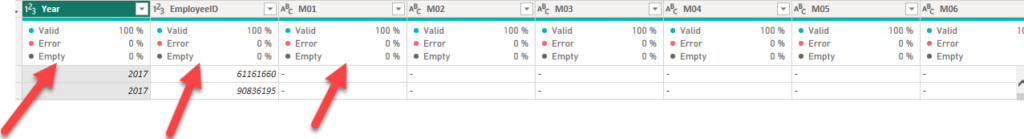
- To assess column quality, on the View ribbon tab, from inside the Data Preview group, check Column Quality. The column quality feature allows you to easily determine the percentage of valid, error, or empty values found in columns.
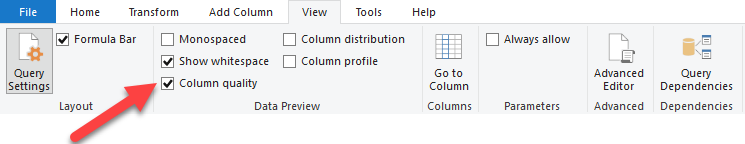
- To assess column distribution, on the View ribbon tab, from inside the Data Preview group, check Column Distribution.
- Review the Position column again, and notice that there are four distinct values, and one unique value.
- Review the column distribution for the EmployeeKey column – there are 296 distinct values, and 296 unique values.

Note: When the distinct and unique counts are the same, it means the column contains unique values. When modeling, it’s important that some model tables have unique columns. These unique columns can be used to create one-to-many relationships, which you’ll do in one of the next labs.
- In the Queries pane, select the DimReseller query.
- To view column values, on the View ribbon tab, from inside the Data Preview group, check Column Profile.
- Select the BusinessType column header, and notice the new pane beneath the data preview pane. Review the column statistics and value distribution in the data preview pane.
- Notice the data quality issue: there are two labels for warehouse (Warehouse, and the misspelled Ware House).
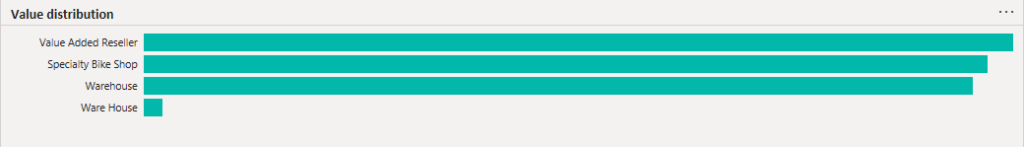
- Hover the cursor over the Ware House bar, and notice that there are five rows with this value.
- Save the file on your local PC
Great start! You’ve just learned how to load the data into Power BI, and how to perform some basic data profiling operations using Power Query Editor.
See you in the next lab!