Power Query is the unsung hero of successful Power BI implementations, serving as the critical bridge between raw, messy data and actionable business insights. In the real world, data rarely arrives in perfect, analysis-ready formats. It comes fragmented across multiple sources, contains inconsistencies, missing values, and formatting issues that can derail your analytics efforts.
By mastering data transformation techniques like merging tables, pivoting columns, handling null values, and creating custom transformations, you’ll eliminate the time-consuming manual data preparation that typically consumes 80% of an analyst’s time, while ensuring your Power BI reports are built on a foundation of clean, reliable, and consistently structured data that stakeholders can trust for critical business decisions.
In this lab, we’ll apply various data transformation and data cleansing techniques to shape the data model.
IMPORTANT: Download the Power BI starter solution from here.
OPTIONAL: Download all the source CSV files from here. Once downloaded, extract the source files to the folder on your local PC.
Configure the Salesperson query
In this task, you’ll use Power Query Editor to configure the Salesperson query.
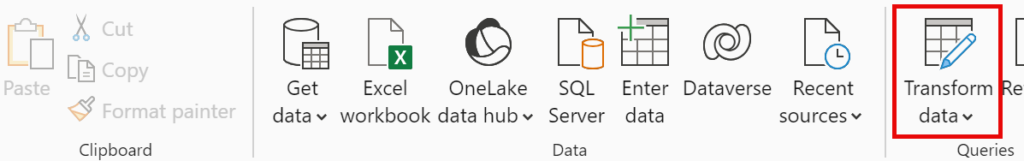
- To open the Power Query Editor window, on the Home ribbon tab, from inside the Queries group, select the Transform Data icon.
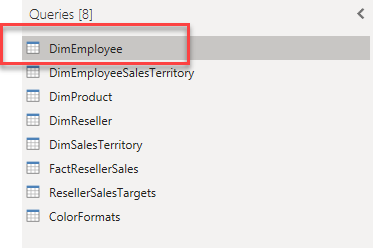
- In the Power Query Editor window, in the Queries pane, select the DimEmployee query.
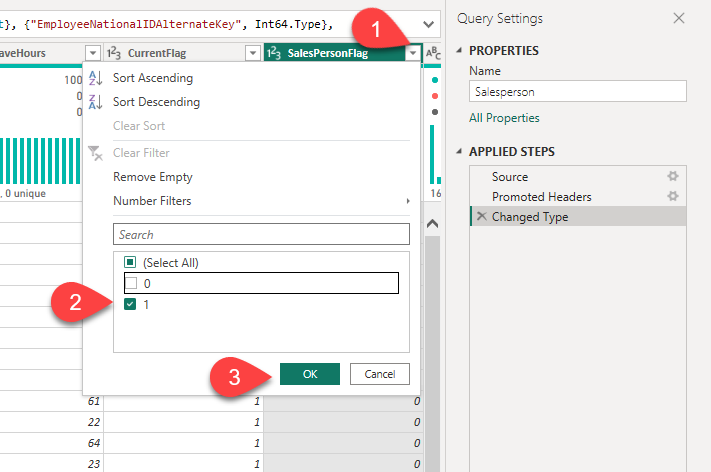
- To rename the query, in the Query Settings pane (located at the right), in the Name box, replace the text with Salesperson, and then press Enter. Then verify the name has been updated in the Queries pane. Alternatively, you can double-click on the DimEmployee query and type the Salesperson.
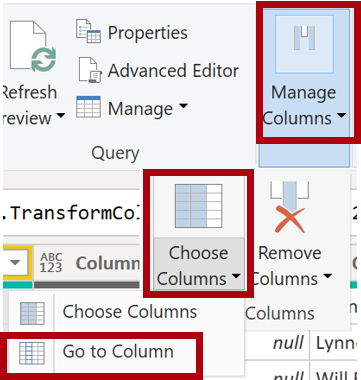
To locate a specific column, on the Home ribbon tab, from inside the Manage Columns group, select the Choose Columns down-arrow, and then select Go to Column.
- In the Go to Column window, to order the list by column name, select the AZ sort button, and then select Name and SalesPersonFlag. Click OK.
- Locate the SalesPersonFlag column, then click on the down arrow next to the column name, filter the column to select only Salespeople (that is, 1), and click OK.
- In the Query Settings pane, in the Applied Steps list, notice the addition of the Filtered Rows step.
Each transformation you apply, creates another transformation step and its own logic. It’s possible to go back and forth and edit or delete steps. It’s also possible to select a step to preview the query results at that stage of the query transformation.
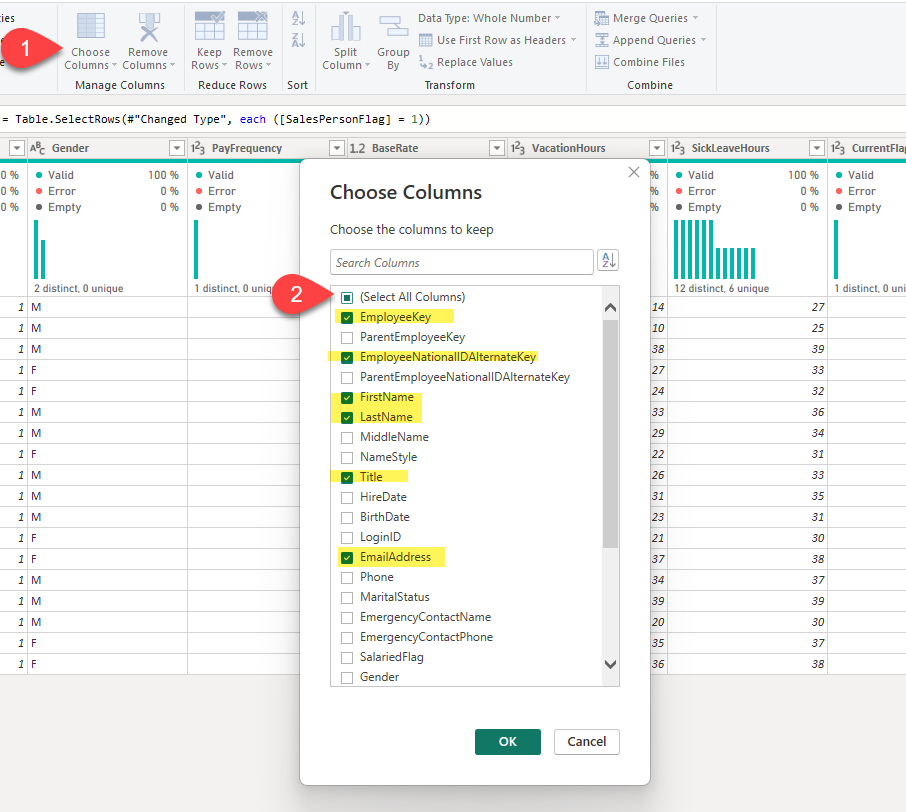
- To remove columns, on the Home ribbon tab, from inside the Manage Columns group, select the Choose Columns icon.
- In the Choose Columns window, to uncheck all columns, uncheck the (Select All Columns) item.
- To include columns, check the following six columns:
- EmployeeKey
- EmployeeNationalIDAlternateKey
- FirstName
- LastName
- Title
- EmailAddress
- In the Applied Steps list, notice the addition of another query step (Removed Other Columns)
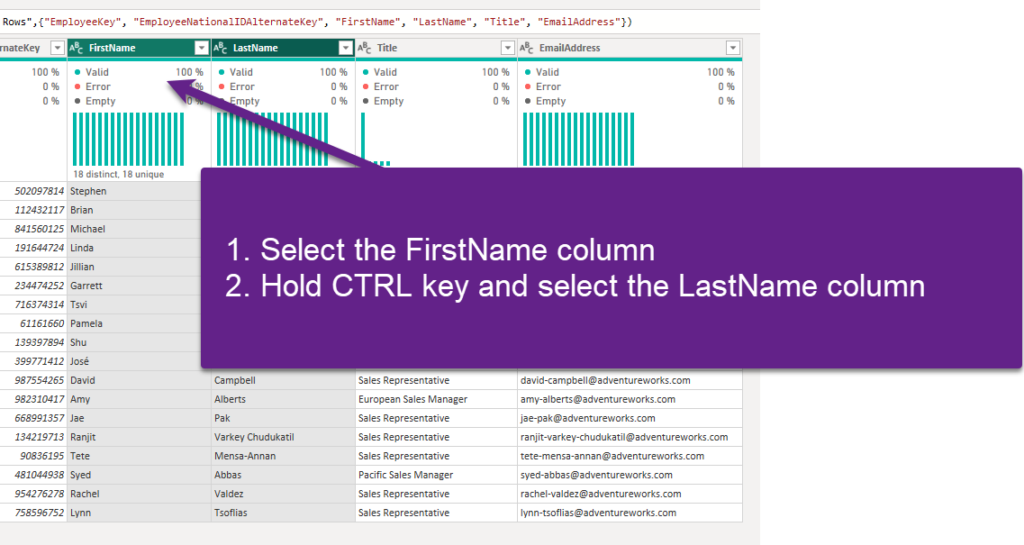
The next step is to create a column: Salesperson, which will represent the full name of the salesperson. Currently, we have the FirstName and LastName as separate columns.
- Start by selecting the FirstName column header. While pressing the Ctrl key, select the LastName column.
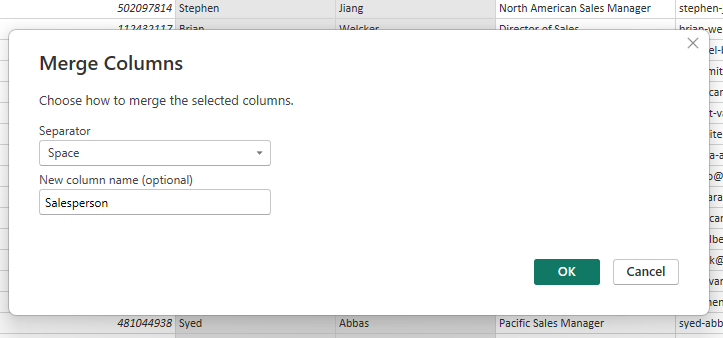
- Right-click either of the selected column headers, and then in the context menu, select Merge Columns.
- In the Merge Columns window, in the Separator dropdown list, select Space.
- In the New Column Name box, replace the text with Salesperson.
- To rename the EmployeeNationalIDAlternateKey column, double-click the EmployeeNationalIDAlternateKey column header and replace the text with EmployeeID, and then press Enter.
- Use the previous steps to rename the EmailAddress column to UPN. UPN is an abbreviation of the User Principal Name
At the bottom left, in the status bar, verify that the query has 5 columns and 18 rows.
Configure the SalespersonRegion query
- In the Queries pane, select the DimEmployeeSalesTerritory query.
- In the Query Settings pane, rename the query to SalespersonRegion.
In the status bar, verify that the query has 2 columns and 39 rows.
Configure the ProductCategory query
Select the DimProductCategory query and rename the query to ProductCategory.
Remove all columns except the following:
- ProductCategoryKey
- EnglishProductCategoryName
- Rename the EnglishProductCategoryName column to ProductCategory
In the status bar, verify that the query has 2 columns and 4 rows.
Configure the ProductSubcategory query
Select the DimProductSubcategory query and rename the query to ProductSubcategory.
Remove all columns except the following:
- ProductSubcategoryKey
- EnglishProductSubcategoryName
- ProductCategoryKey
- Rename the EnglishProductSubcategoryName column to ProductSubcategory
In the status bar, verify that the query has 3 columns and 37 rows.
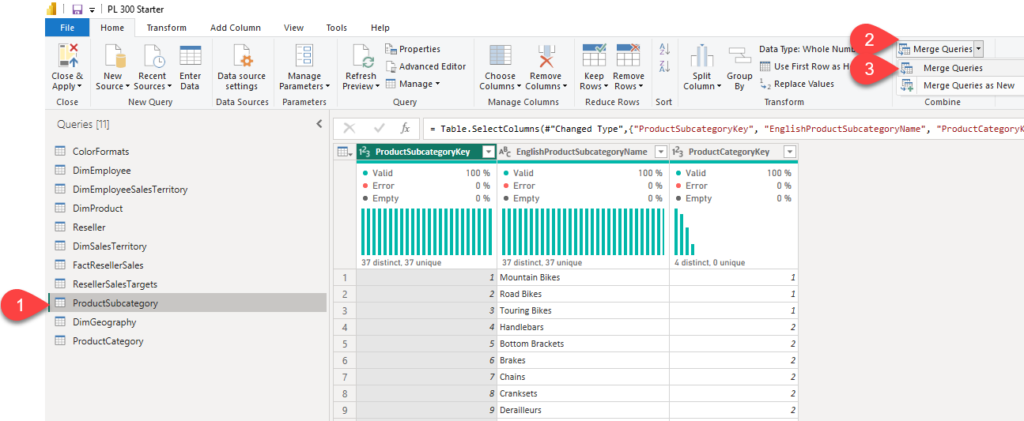
In the next step, we will combine columns from two different queries. We want to include the information about the product category in the ProductSubcategory query.
Select the ProductSubcategory query. In the Home ribbon, under the Combine area, click on Merge Queries, and then select Merge Queries from the drop-down menu:
In the Merge dialog window, select the ProductCategory table and choose the ProductCategoryKey column in both tables. This is the common column between these two tables, and as such, it will be used to perform the Join operation.
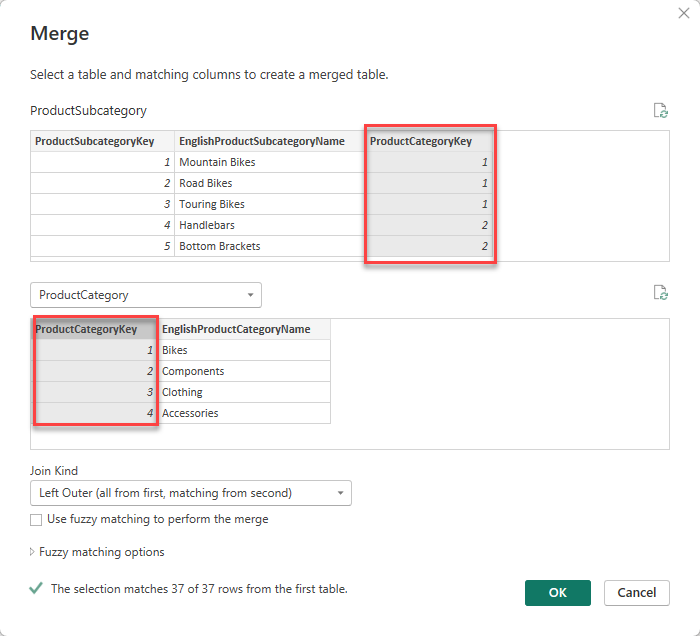
Notice the additional “column” in the ProductSubcategory table. This is not the regular column, but the table we’ve just joined.
- Click on the Expand icon in the right corner of the ProductCategory column
- Choose the ProductCategory column
- Ensure that the “Use original column name as prefix” box is unchecked
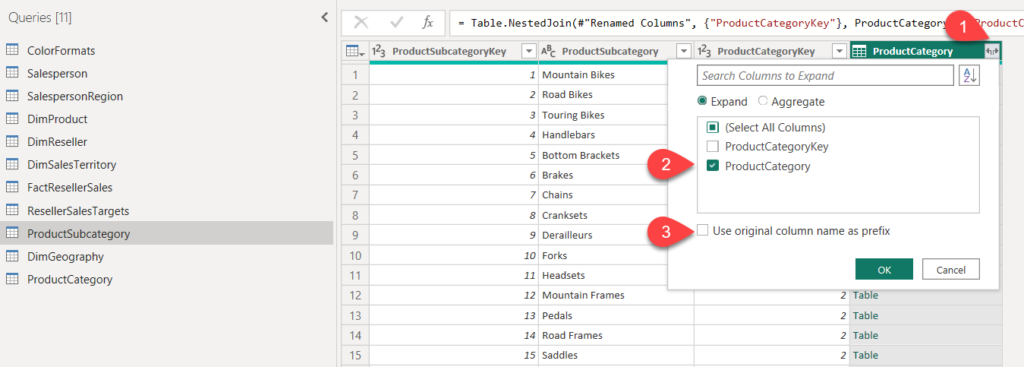
- Rename the ProductCategory.1 column to ProductCategory
In the status bar, verify that the query now has 4 columns and 37 rows.
Configure the Product query
- Select the DimProduct query and rename the query to Product.
- Locate the FinishedGoodsFlag column, and then filter the column to retrieve products that are finished goods (that is, 1).
- Remove all columns, except the following:
- ProductKey
- ProductSubcategoryKey
- EnglishProductName
- StandardCost
- Color
Rename the following columns:
- EnglishProductName to Product
- StandardCost to Standard Cost (include a space)
In the status bar, verify that the query has 5 columns and 397 rows.
In the next step, we will merge the data from the ProductSubcategory into the Product table.
If you try to repeat the steps from the previous section, when we merged ProductSubcategory and ProductCategory, you’ll encounter an error, even though you are joining tables on the common column:
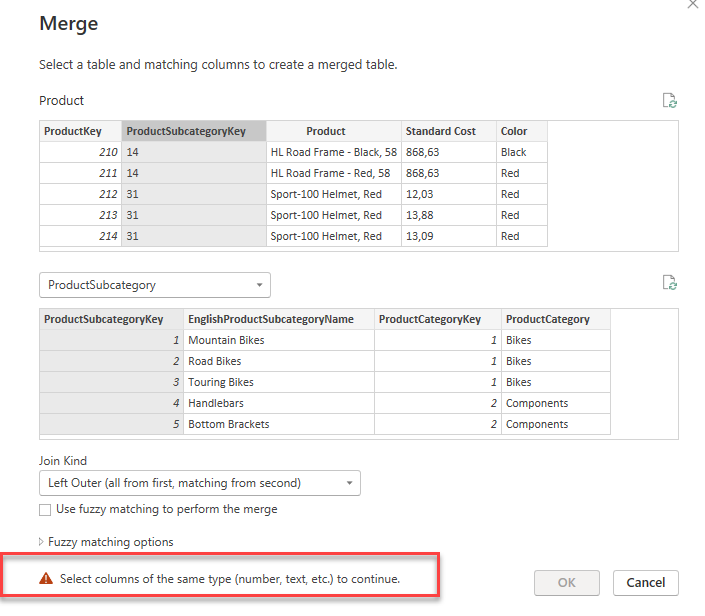
The issue here is that the columns are of different data types. Hence, we first need to fix this problem.
If you take a look at the Product table, you’ll notice that the ProductSubcategoryKey is of Text data type:
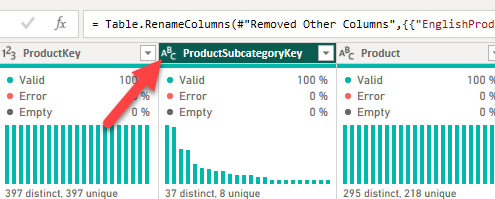
- Click on the ABC icon and choose Whole number (123) from the drop-down menu.
Now, let’s try to merge tables again.
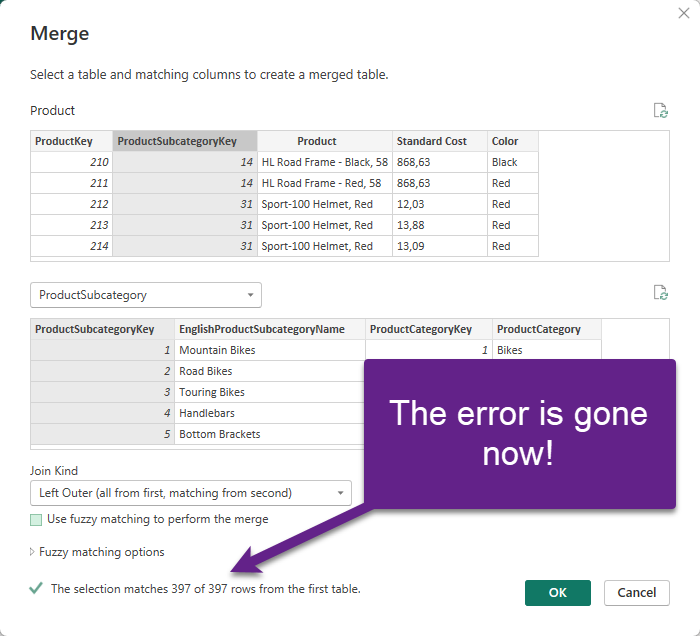
Great! It worked!
- Expand the ProductSubcategory table from the last “column”
- Select the ProductSubcategory and ProductCategory columns
- Ensure that the “Use original column name as prefix” box is unchecked
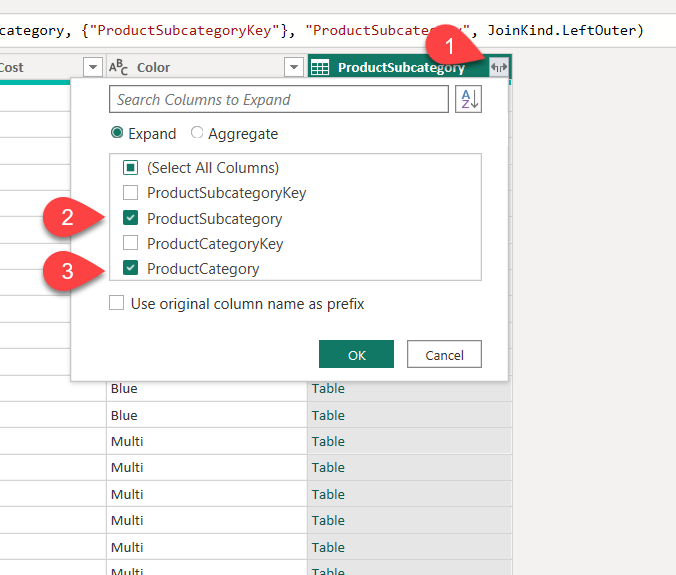
- Rename the ProductSubcategory.1 to ProductSubcategory
In the status bar, verify that the query now has 7 columns and 397 rows.
Configure the Reseller query
- Select the DimReseller query and rename it to Reseller.
- Remove all columns, except the following:
- ResellerKey
- GeographyKey
- BusinessType
- ResellerName
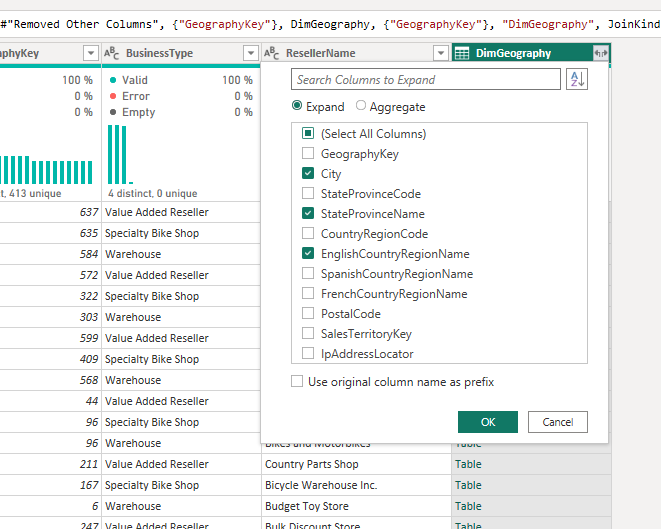
In the next step, we will merge the data from the DimGeography into the Reseller table.

- Expand the DimGeography column, to include only the following three columns:
- City
- StateProvinceName
- EnglishCountryRegionName
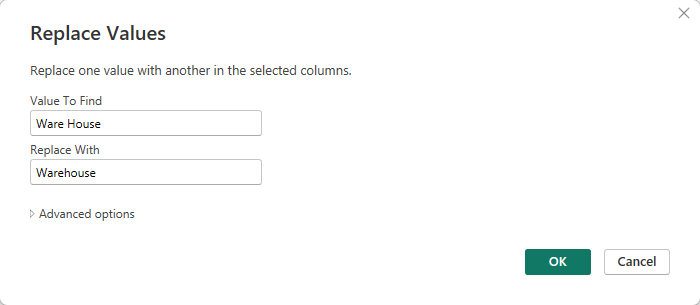
- On the Business Type column header, select the down-arrow, and then review the distinct column values, and notice both values Warehouse and Ware House.
- Right-click the Business Type column header, and then select Replace Values.
- In the Replace Values window, configure the following values:
- In the Value to Find box, enter Ware House
- In the Replace With box, enter Warehouse
- Rename the following four columns:
- BusinessType to Business Type (include a space)
- ResellerName to Reseller
- StateProvinceName to State-Province
- EnglishCountryRegionName to Country-Region
In the status bar, verify that the query has 7 columns and 701 rows.
Configure the Region query
- Select the DimSalesTerritory query and rename the query to Region.
- Apply a filter to the SalesTerritoryAlternateKey column to remove the value 0 (zero).
- Remove all columns, except the following:
- SalesTerritoryKey
- SalesTerritoryRegion
- SalesTerritoryCountry
- SalesTerritoryGroup
- Rename the following three columns:
- SalesTerritoryRegion to Region
- SalesTerritoryCountry to Country
- SalesTerritoryGroup to Group
In the status bar, verify that the query has 4 columns and 10 rows.
Configure the Sales query
- Select the FactResellerSales query and rename it to Sales.
- Remove all columns, except the following:
- SalesOrderNumber
- OrderDate
- ProductKey
- ResellerKey
- EmployeeKey
- SalesTerritoryKey
- OrderQuantity
- UnitPrice
- TotalProductCost
- SalesAmount
If you take a thorough look at the TotalProductCost column, you’ll notice that Power BI assigned it Any (ABC 123) data type. This is considered a bad practice, as you want to assign a proper data type to each of the columns. We will now manually change the data type of the TotalProductCost column.
- Click on the ABC 123 icon next to the TotalProductCost column name
- From the drop-down menu, select Fixed decimal number
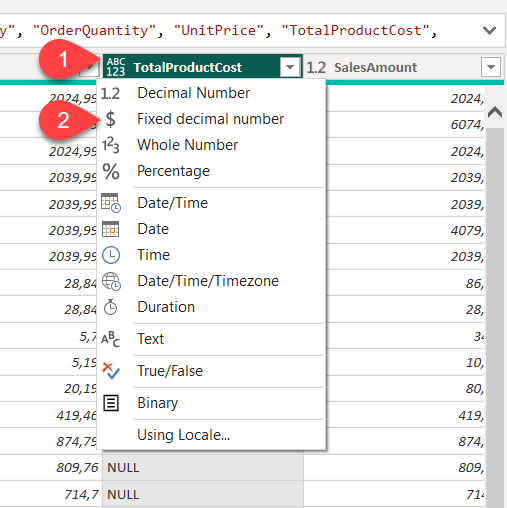
You should be able to see the values stored with 2 digits of precision after the decimal point.
Since we have some missing values in the TotalProductCost column, we will populate these values by using the StandardCost column from the Product table.
- Merge the Sales and the Product tables on the ProductKey column
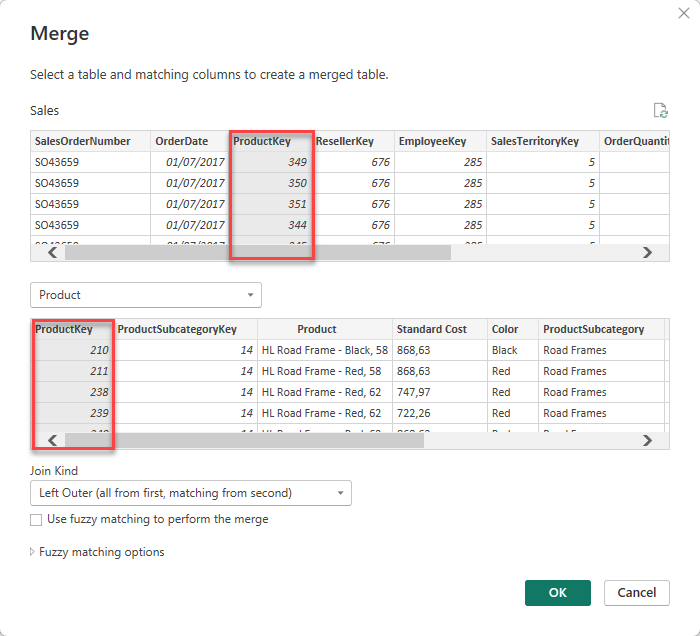
- Expand the Product column and choose only the Standard Cost column

- Change the data type of the Standard Cost column to Fixed decimal number ($)
In the next step, we will implement the following logic: whenever the value is empty for the TotalProductCost, the Standard Cost value multiplied by the Order Quantity value will be displayed. To achieve that, we will create a new custom column in the table.
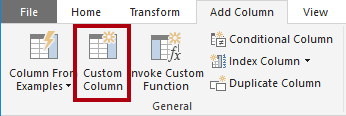
- To create a custom column, on the Add Column ribbon tab, from inside the General group, select Custom Column.
- In the Custom Column window, in the New Column Name box, replace the text with Cost.
- In the Custom Column Formula box, enter the following expression (after the equals symbol), then save the new column:
if [TotalProductCost] = null then [OrderQuantity] * [Standard Cost] else [TotalProductCost]
- Navigate to the last transformation step (Added Custom) and confirm that values in the Cost column do not contain empty records
- Remove the following two columns:
- TotalProductCost
- Standard Cost
- Rename the following three columns:
- OrderQuantity to Quantity
- UnitPrice to Unit Price (include a space)
- SalesAmount to Sales
- Modify the Cost column data type to Fixed Decimal Number.
In the status bar, verify that the query has 10 columns and 999+ rows.
Configure the Targets query
- Select the ResellerSalesTargets query and rename to Targets.
- To unpivot the 12 month columns (M01–M12), first multi-select the Year and EmployeeID column headers.
- Right-click either of the select column headers, and then in the context menu, select Unpivot Other Columns.
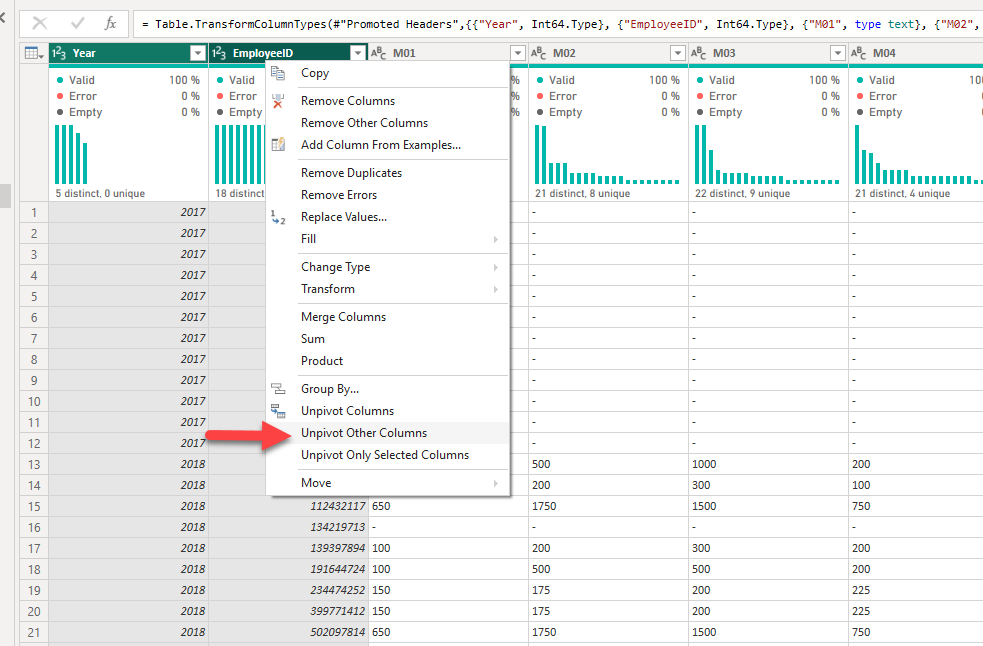
- Notice that the column names now appear in the Attribute column, and the values appear in the Value column.
- Apply a filter to the Value column to remove hyphen (-) values.
- Rename the following two columns:
- Attribute to MonthNumber
- Value to Target
- To prepare the MonthNumber column values, right-click the MonthNumber column header, and then select Replace Values.
- In the Replace Values window, in the Value To Find box, enter M and leave the Replace with empty.

- Modify the MonthNumber column data type to Whole Number.
- On the Add Column ribbon tab, from inside the General group, select the Column From Examples icon.
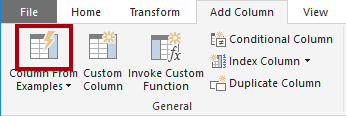
- Notice that the first row is for year 2017 and month number 7.
- In the Column1 column, in the first grid cell, commence entering 7/1/2017, and then press Enter.
Notice that the grid cells update with predicted values.
Notice also the formula presented above the query grid.
Note: The formula may vary depending on your locale settings.
- To rename the new column, double-click the Merged column header and rename the column as TargetMonth.
- Remove the following columns:
- Year
- MonthNumber
- Modify the following column data types:
- Target as fixed decimal number
- TargetMonth as date
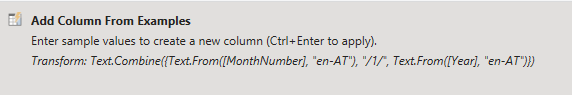
- To multiply the Target values by 1000, select the Target column header, and then on the Transform ribbon tab, from inside the Number Column group, select Standard, and then select Multiply.
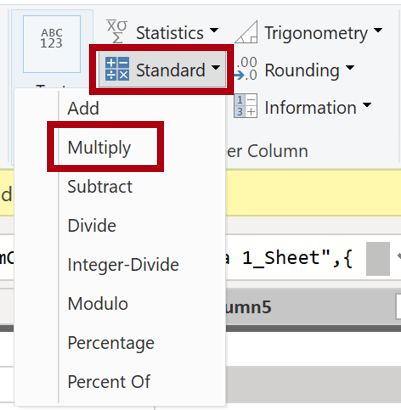
- In the Multiply window, in the Value box, enter 1000, and select OK.
In the status bar, verify that the query has 3 columns and 809 rows.
Configure the ColorFormats query
- Select the ColorFormats query and notice that the first row contains the column names.
- On the Home ribbon tab, from inside the Transform group, select Use First Row as Headers.
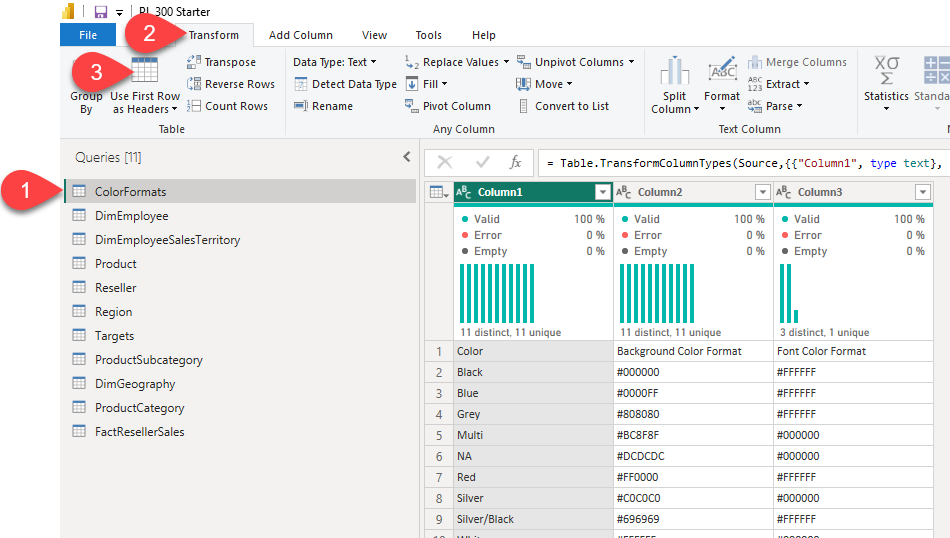
In the status bar, verify that the query has 3 columns and 10 rows.
Update the Product query
- Select the Product query.
- To merge the ColorFormats query, on the Home ribbon tab, from inside the Combine group, select Merge Queries.
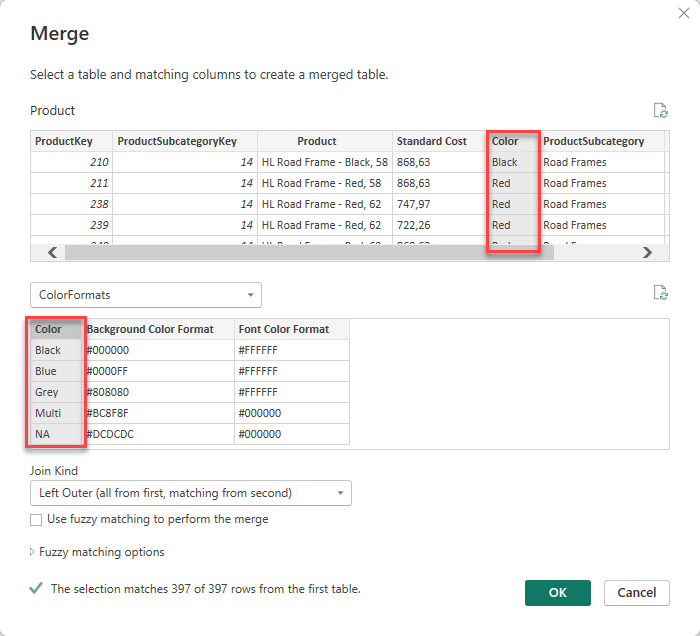
- Expand the ColorFormats column to include the following two columns:
- Background Color Format
- Font Color Format
In the status bar, verify that the query now has 9 columns and 397 rows.
Disable Query Loading
In this step, we will disable the loading of the queries that are not needed in the report. Those are all the queries that we used to merge the data in the previous sections.
- Right-click on the ColorFormats query and click on the Enable Load option in the drop-down menu
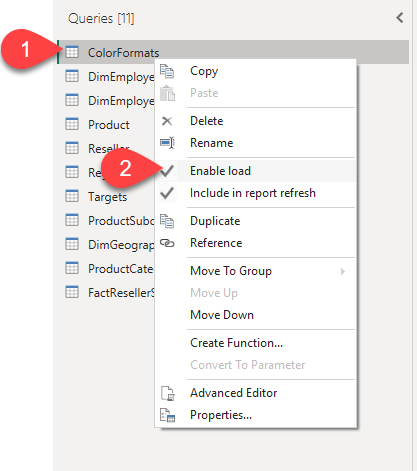
- Repeat the same process for the following queries:
- ProductSubcategory
- ProductCategory
- DimGeography
Final Check
If you completed all the steps, you should have 7 queries that will be loaded into the Power BI model:
- Salesperson
- SalespersonRegion
- Product
- Reseller
- Region
- Targets
- Sales
And 4 queries that will NOT be loaded into the Power BI model (but are used to build the model):
- ColorFormats
- ProductSubcategory
- ProductCategory
- DimGeography
Save your work, as we will continue the next lab from this point.
Great work! You just learned how to apply various transformation techniques to clean and shape your Power BI data model in the proper way. See you in the next lab!