In Microsoft Fabric, a data warehouse provides a relational database for large-scale analytics. Unlike the read-only SQL endpoint for tables defined in a lakehouse, a data warehouse provides full SQL semantics, including the ability to insert, update, and delete data in the tables.
Let’s create our first warehouse!
- In the top left corner, select New item. In the New item page, select Warehouse (NOT a sample warehouse!). Give it a name: DWH_Fabric_Bootcamp.
After a minute or so, a new warehouse will be created:
Create tables and insert data
A warehouse is a relational database in which you can define tables and other objects.
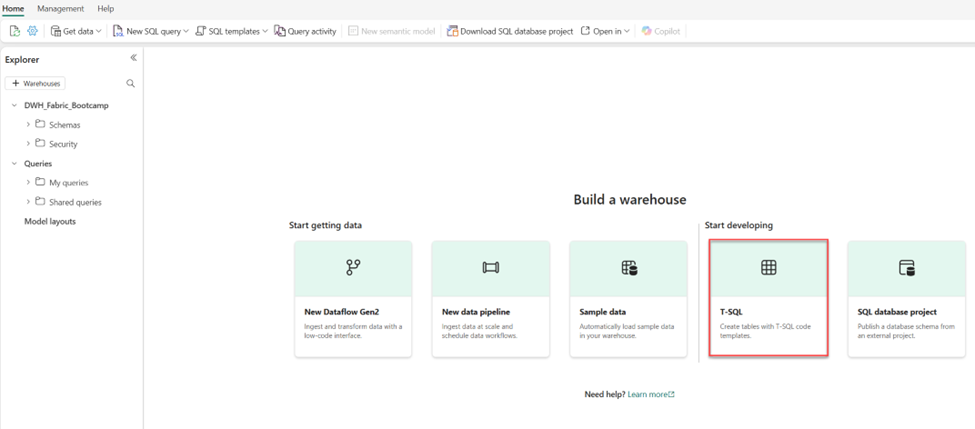
- In your DWH_Fabric_Bootcamp warehouse, select the T-SQL tile, and use the following CREATE TABLE statement:
CREATE TABLE dbo.DimProduct
(
    ProductKey INTEGER NOT NULL,
    ProductAltKey VARCHAR(25) NULL,
    ProductName VARCHAR(50) NOT NULL,
    Category VARCHAR(50) NULL,
    ListPrice DECIMAL(5,2) NULL
);
GO
- Use the ▷ Run button to run the SQL script, which creates a new table named DimProduct in the dbo schema of the data warehouse.
- Use the Refresh button on the toolbar to refresh the view. Then, in the Explorer pane, expand Schemas > dbo > Tables and verify that the DimProduct table has been created.
- On the Home menu tab, use the New SQL Query button to create a new query, and enter the following INSERT statement:
INSERT INTO dbo.DimProduct
VALUES
(1, 'RING1', 'Bicycle bell', 'Accessories', 5.99),
(2, 'BRITE1', 'Front light', 'Accessories', 15.49),
(3, 'BRITE2', 'Rear light', 'Accessories', 15.49);
GO
- Run the new query to insert three rows into the DimProduct table.
- When the query has finished, in the Explorer pane, select the DimProduct table and verify that the three rows have been added to the table.
- On the Home menu tab, use the New SQL Query button to create a new query. Then copy and paste the Transact-SQL code from https://raw.githubusercontent.com/MicrosoftLearning/dp-data/main/create-dw.txt into the new query pane.
- Run the query, which creates a simple data warehouse schema and loads some data. The script should take around 30 seconds to run.
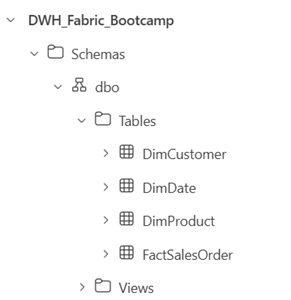
- Use the Refresh button on the toolbar to refresh the view. Then in the Explorer pane, verify that the dbo schema in the data warehouse now contains the following four tables:
- DimCustomer
- DimDate
- DimProduct
- FactSalesOrder
Define a data model
A relational data warehouse typically consists of fact and dimension tables. The fact tables contain numeric measures you can aggregate to analyze business performance (for example, sales revenue), and the dimension tables contain attributes of the entities by which you can aggregate the data (for example, product, customer, or time). In a Microsoft Fabric data warehouse, you can use these keys to define a data model that encapsulates the relationships between the tables.
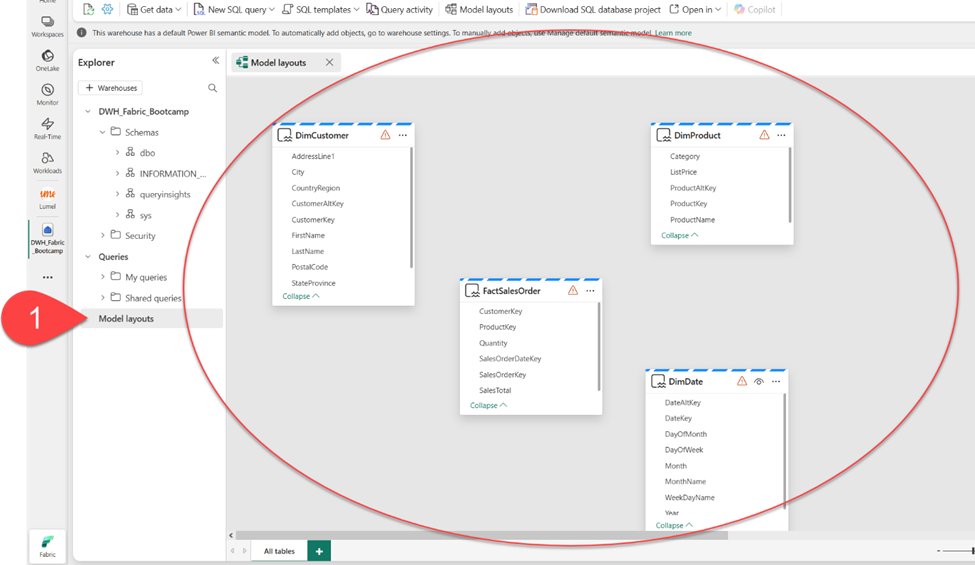
- In the toolbar, select the Model layouts button.
- In the model pane, rearrange the tables in your data warehouse so that the FactSalesOrder table is in the middle, like this:
Note: The system views: frequently_run_queries, long_running_queries, exec_sessions_history, and exec_requests_history are part of the queryinsights schema automatically created by Fabric. It is a feature that provides a holistic view of historical query activity on the SQL analytics endpoint. Since this feature is out of the scope of this lab, those views should be ignored for now.
- Drag the ProductKey field from the FactSalesOrder table and drop it on the ProductKey field in the DimProduct table. Then confirm the following relationship details:
- From table: FactSalesOrder
- Column: ProductKey
- To table: DimProduct
- Column: ProductKey
- Cardinality: Many to one (*:1)
- Cross filter direction: Single
- Make this relationship active: Selected
- Assume referential integrity: Unselected
- Repeat the process to create many-to-one relationships between the following tables:
- FactSalesOrder.CustomerKey → DimCustomer.CustomerKey
- FactSalesOrder.SalesOrderDateKey → DimDate.DateKey
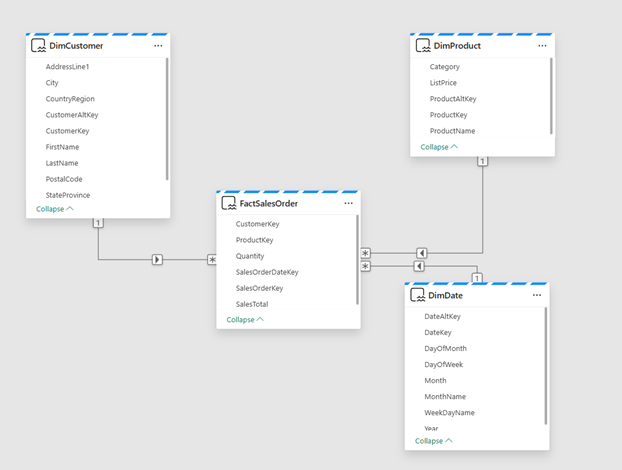
When all of the relationships have been defined, the model should look like this:
Query data warehouse tables
Since the data warehouse is a relational database, you can use SQL to query its tables.
Query fact and dimension tables
Most queries in a relational data warehouse involve aggregating and grouping data (using aggregate functions and GROUP BY clauses) across related tables (using JOIN clauses).
- Create a new SQL Query, and run the following code:
SELECT  d.[Year] AS CalendarYear,
         d.[Month] AS MonthOfYear,
         d.MonthName AS MonthName,
        SUM(so.SalesTotal) AS SalesRevenue
FROM FactSalesOrder AS so
JOIN DimDate AS d ON so.SalesOrderDateKey = d.DateKey
GROUP BY d.[Year], d.[Month], d.MonthName
ORDER BY CalendarYear, MonthOfYear;
Note that the attributes in the date dimension enable you to aggregate the measures in the fact table at multiple hierarchical levels – in this case, year and month. This is a common pattern in data warehouses.
- Modify the query as follows to add a second dimension to the aggregation.
SELECT  d.[Year] AS CalendarYear,
        d.[Month] AS MonthOfYear,
        d.MonthName AS MonthName,
        c.CountryRegion AS SalesRegion,
       SUM(so.SalesTotal) AS SalesRevenue
FROM FactSalesOrder AS so
JOIN DimDate AS d ON so.SalesOrderDateKey = d.DateKey
JOIN DimCustomer AS c ON so.CustomerKey = c.CustomerKey
GROUP BY d.[Year], d.[Month], d.MonthName, c.CountryRegion
ORDER BY CalendarYear, MonthOfYear, SalesRegion;
- Run the modified query and review the results, which now include sales revenue aggregated by year, month, and sales region.
Create a view
A data warehouse in Microsoft Fabric has many of the same capabilities you may be know from relational databases. For example, you can create database objects like views and stored procedures to encapsulate SQL logic.
- Modify the query you created previously as follows to create a view (note that you need to remove the ORDER BY clause to create a view).
CREATE VIEW vSalesByRegion
AS
SELECT  d.[Year] AS CalendarYear,
        d.[Month] AS MonthOfYear,
        d.MonthName AS MonthName,
        c.CountryRegion AS SalesRegion,
       SUM(so.SalesTotal) AS SalesRevenue
FROM FactSalesOrder AS so
JOIN DimDate AS d ON so.SalesOrderDateKey = d.DateKey
JOIN DimCustomer AS c ON so.CustomerKey = c.CustomerKey
GROUP BY d.[Year], d.[Month], d.MonthName, c.CountryRegion;
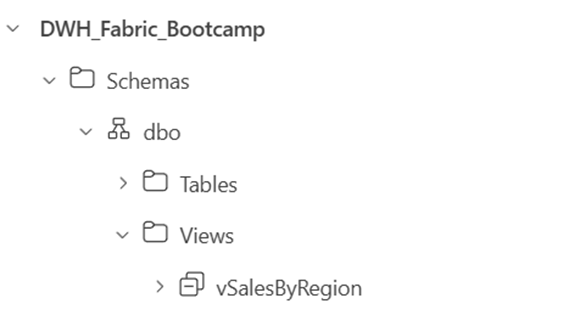
Run the query to create the view. Then refresh the data warehouse schema and verify that the new view is listed in the Explorer pane.
- Create a new SQL query and run the following SELECT statement:
SELECT CalendarYear, MonthName, SalesRegion, SalesRevenue
FROM vSalesByRegion
ORDER BY CalendarYear, MonthOfYear, SalesRegion;
Create a visual query
Instead of writing SQL code, you can use the graphical query designer to query the tables in your data warehouse. This experience is similar to Power Query online, where you can create data transformation steps with no code. For more complex tasks, you can use Power Query’s M (Mashup) language.
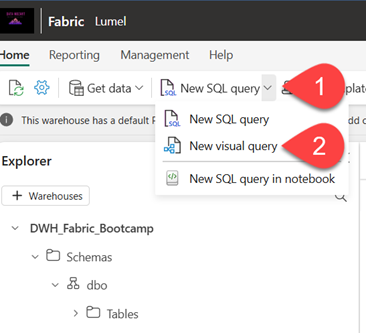
- On the Home menu, expand the options under New SQL query and select New visual query.
- Drag FactSalesOrder onto the canvas. Notice that a preview of the table is displayed in the Preview pane below.
- Drag DimProduct onto the canvas. We now have two tables in our query.
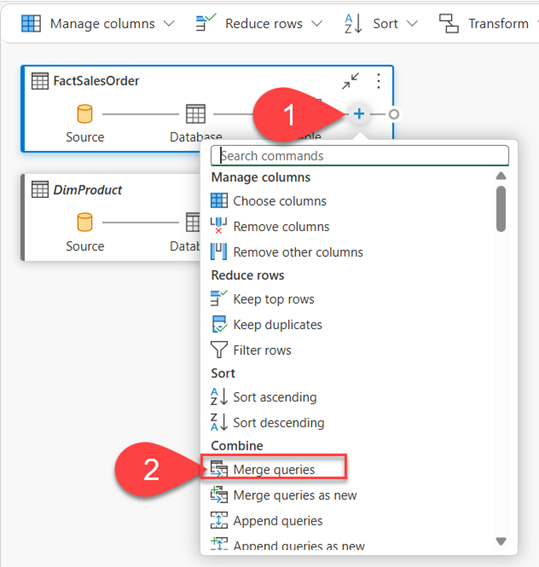
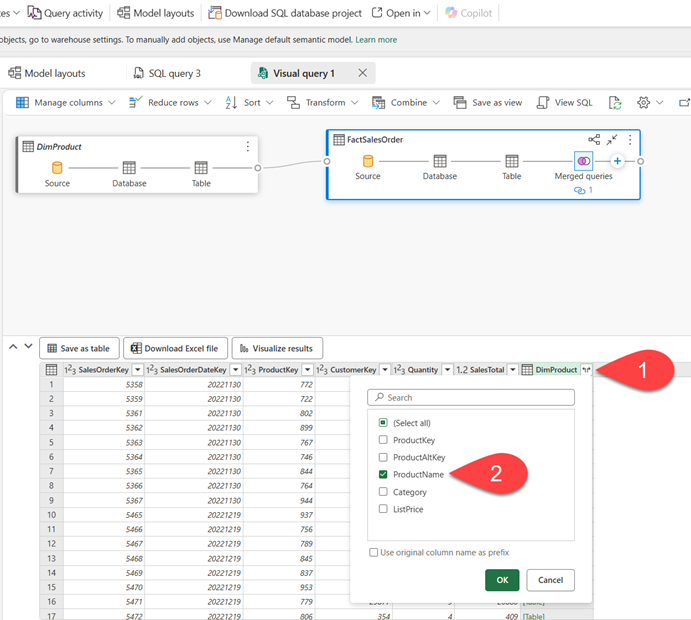
- Use the (+) button on the FactSalesOrder table on the canvas to Merge queries.
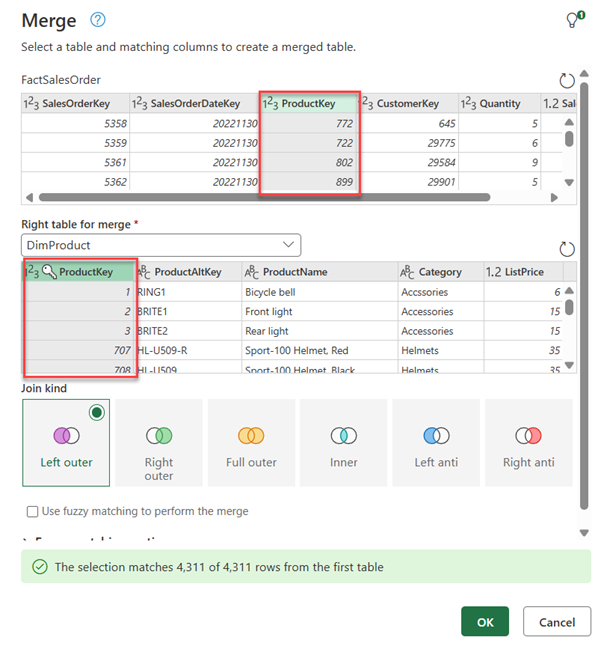
- In the Merge queries window, select DimProduct as the right table for merge. Select ProductKey in both queries, leave the default Left outer join type, and click OK.
- In the Preview, note that the new DimProduct column has been added to the FactSalesOrder table. Expand the column by clicking the arrow to the right of the column name. Select ProductName and click OK.
- If you’re interested in looking at data for a single product, per a manager request, you can now use the ProductName column to filter the data in the query. Filter the ProductName column to look at Cable Lock data only.
- From here, you can analyze the results of this single query by selecting Visualize results or Download Excel file. You can now see exactly what the manager was asking for, so we don’t need to analyze the results further.
Bam! Another one under your toolbelt! You’ve just learned not only how to create a warehouse in Microsoft Fabric, but also how to query and analyze the data in the warehouse – both by writing T-SQL code and using no-code Visual Query Editor. Well done!