A simple way to ingest data is to use a Copy Data activity in a pipeline to extract the data from a source and copy it to a file in the lakehouse.
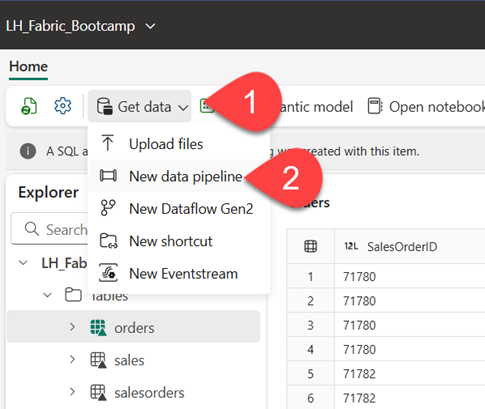
- On the Home page of your LH_Fabric_Bootcamp lakehouse, select Get data and then select New data pipeline
- Create a new data pipeline named Ingest Sales Data.
- If the Copy Data wizard doesn’t open automatically, select Copy Data > Use copy assistant in the pipeline editor page.
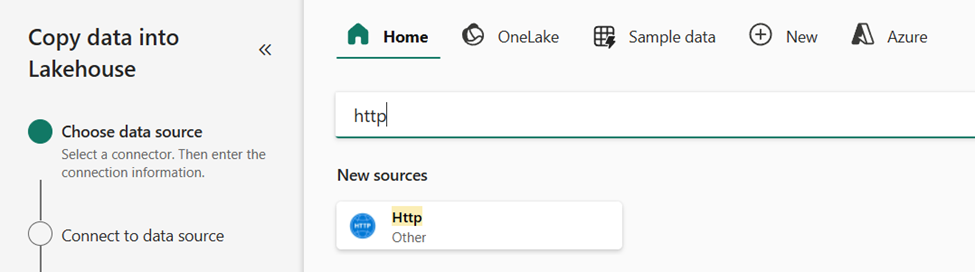
- In the Copy Data wizard, on the Choose data source page, type HTTP in the search bar and then select HTTP in the New sources section.
- In the Connect to data source pane, enter the following settings for the connection to your data source:
- URL: https://raw.githubusercontent.com/MicrosoftLearning/dp-data/main/sales.csv
- Connection: Create new connection
- Connection name: Specify a unique name
- Data gateway: (none)
- Authentication kind: Anonymous
- Select Next. Then ensure the following settings are selected:
- Relative URL: Leave blank
- Request method: GET
- Additional headers: Leave blank
- Binary copy: Unselected
- Request timeout: Leave blank
- Max concurrent connections: Leave blank
- Select Next, and wait for the data to be sampled and then ensure that the following settings are selected:
- File format: DelimitedText
- Column delimiter: Comma (,)
- Row delimiter: Line feed (\n)
- First row as header: Selected
- Compression type: No compression
- Select Preview data to see a sample of the data that will be ingested. Then close the data preview and select Next.
- On the Connect to data destination page, set the following data destination options, and then select Next:
- Root folder: Files
- Folder path name: new_data
- File name: sales.csv
- Copy behavior: None
- Set the following file format options and then select Next:
- File format: DelimitedText
- Column delimiter: Comma (,)
- Row delimiter: Line feed (\n)
- Add header to file: Selected
- Compression type: No compression
- On the Copy summary page, review the details of your copy operation and then select Save + Run. A new pipeline containing a Copy Data activity is created, as shown below:
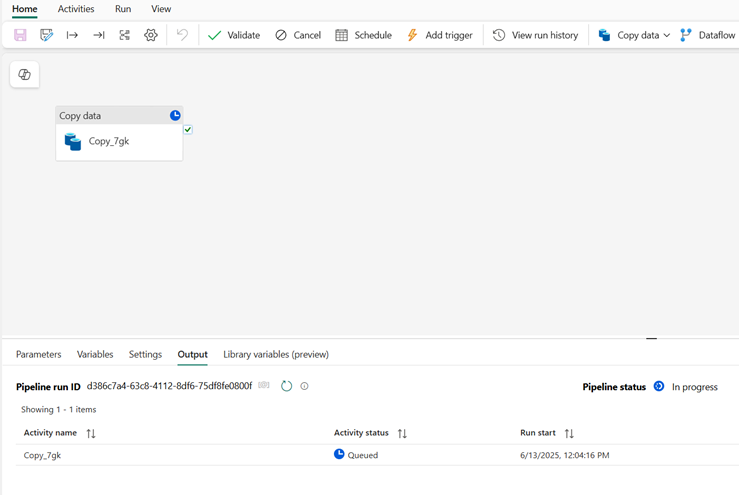
- When the pipeline starts to run, you can monitor its status in the Output pane under the pipeline designer. Use the ↻ (Refresh) icon to refresh the status, and wait until it has succeeded.
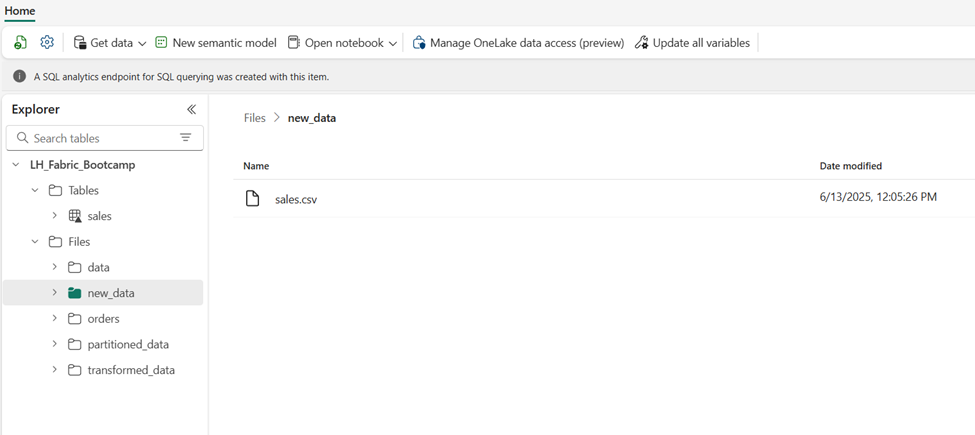
- In the menu bar on the left, select your lakehouse.
- On the Home page, in the Explorer pane, expand Files and select the new_data folder to verify that the sales.csv file has been copied.
Create a notebook
- On the Home page for your lakehouse, in the Open notebook menu, select New notebook.
After a few seconds, a new notebook containing a single cell will open.
- Select the existing cell in the notebook that contains some sample code, and then replace the default code with the following variable declaration.
table_name = "salesPipeline"
- In the … menu for the cell (at its top-right) select Toggle parameter cell. This configures the cell so that the variables declared in it are treated as parameters when running the notebook from a pipeline.
- Under the parameters cell, use the + Code button to add a new code cell. Then add the following code to it:
from pyspark.sql.functions import *

# Read the new sales data
df = spark.read.format("csv").option("header","true").load("Files/new_data/*.csv")

## Add month and year columns
df = df.withColumn("Year", year(col("OrderDate"))).withColumn("Month", month(col("OrderDate")))

# Derive FirstName and LastName columns
df = df.withColumn("FirstName", split(col("CustomerName"), " ").getItem(0)).withColumn("LastName", split(col("CustomerName"), " ").getItem(1))

# Filter and reorder columns
df = df["SalesOrderNumber", "SalesOrderLineNumber", "OrderDate", "Year", "Month", "FirstName", "LastName", "EmailAddress", "Item", "Quantity", "UnitPrice", "TaxAmount"]

# Load the data into a table
df.write.format("delta").mode("append").saveAsTable(table_name)
- This code loads the data from the sales.csv file that was ingested by the Copy Data activity, applies some transformation logic, and saves the transformed data as a table – appending the data if the table already exists.
- Verify that your notebooks looks similar to this, and then use the ▷ Run all button on the toolbar to run all of the cells it contains.
- When the notebook run has completed, in the Explorer pane on the left, in the … menu for Tables select Refresh and verify that a salespipeline table has been created.
- In the notebook menu bar, use the ⚙️ Settings icon to view the notebook settings. Then set the Name of the notebook to Load Sales Pipeline and close the settings pane.
- In the menu bar on the left, select LH_Fabric_Bootcamp lakehouse.
- In the Explorer pane, refresh the view. Then expand Tables, and select the salespipeline table to see a preview of the data it contains.
Modify the pipeline
Now that you’ve implemented a notebook to transform data and load it into a table, you can incorporate the notebook into a pipeline to create a reusable ETL process.
- In the menu bar on the left, or directly from the workspace home page, select the Ingest Sales Data pipeline you created previously.
- On the Activities tab at the top, in the All activities list, select Delete data.
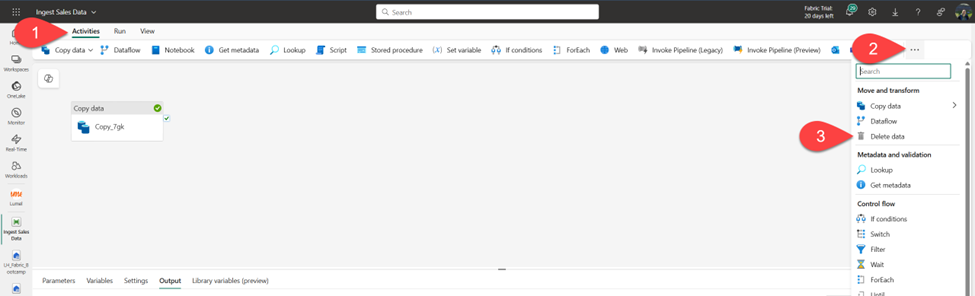
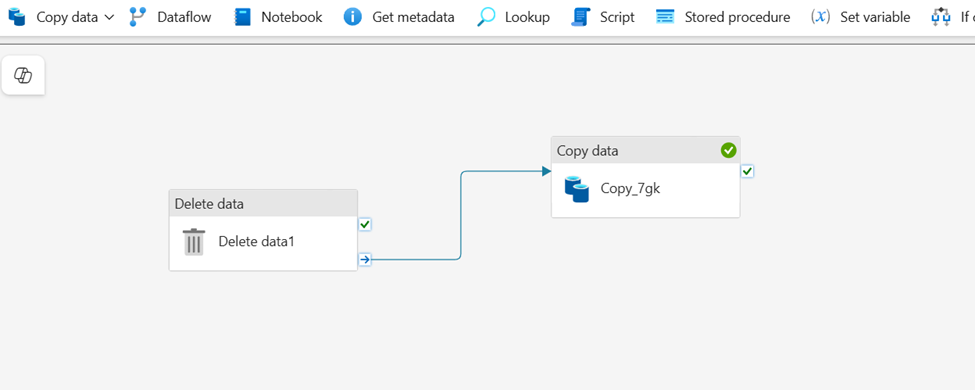
- Then position the new Delete data activity to the left of the Copy data activity and connect its On completion output to the Copy data activity, as shown here:
- Select the Delete data activity, and in the pane below the design canvas, set the following properties:
- General
- Name: Delete old files
- Source
- Connection: Your lakehouse
- File path type: Wildcard file path
- Folder path: Files / new_data
- Wildcard file name: *.csv
- Recursively: Selected
- Logging Settings
- Enable logging: Unselected
These settings will ensure that any existing .csv files are deleted before copying the sales.csv file.
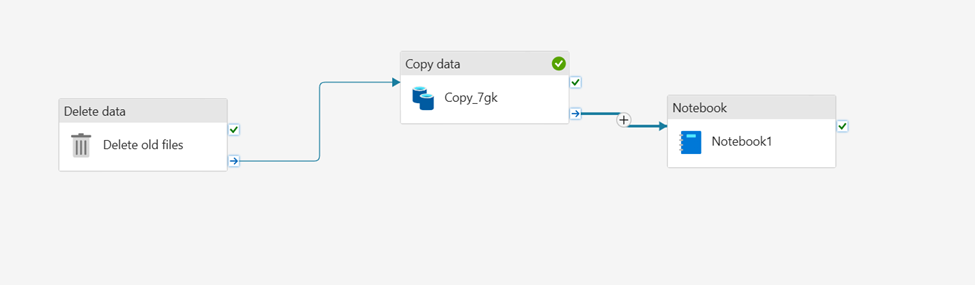
- In the pipeline designer, on the Activities tab, select Notebook to add a Notebook activity to the pipeline.
- Select the Copy data activity and then connect its On Completion output to the Notebook activity as shown below:
- Select the Notebook activity, and then in the pane below the design canvas, set the following properties:
- General:
- Name: Load Sales notebook
- Settings:
- Notebook: Load Sales Pipeline
- Base parameters: Add a new parameter with the following properties:
- General:
| Name | Type | Value |
| table_name | String | new_sales |
The table_name parameter will be passed to the notebook and override the default value assigned to the table_name variable in the parameters cell.
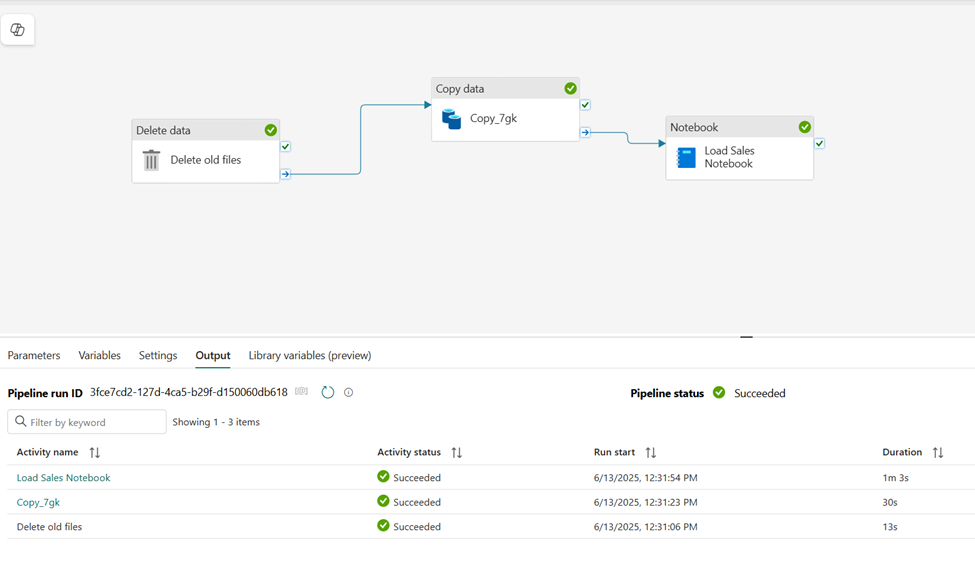
- On the Home tab, use the 🖫 (Save) icon to save the pipeline. Then use the ▷ Run button to run the pipeline, and wait for all of the activities to complete.
Note: In case you receive the error message, Spark SQL queries are only possible in the context of a lakehouse. Please attach a lakehouse to proceed: Open your notebook, select the lakehouse you created on the left pane, select Remove all Lakehouses and then add it again. Go back to the pipeline designer and select ▷ Run.
- In the menu bar on the left , select your lakehouse.
- In the Explorer pane, expand Tables and select the new_sales table to see a preview of the data it contains. This table was created by the notebook when it was run by the pipeline.
Well, well, well…Your Fabric skills are really shaping up quickly! In this lab, you’ve learned how to ingest the data by using a pipeline. Not only that, you’ve also implemented a data orchestration workflow by combining multiple activities and executing them from within the pipeline. Keep up the great work!